All topics

The graph shows the number of floods per decade for a river.
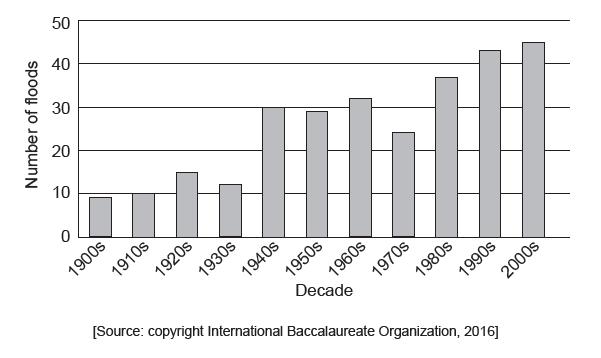

Suggest one physical reason and one human reason why the risk of a river flooding can change over time.

The logarithmic graph shows the discharge of a river and the flood recurrence interval.
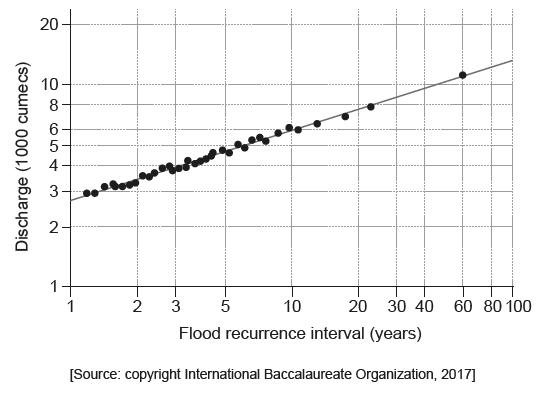

State the relationship between the discharge and the flood recurrence interval shown on the graph.

Suggest why a logarithmic graph was used to show these data.

Estimate the flood recurrence interval for a discharge of 10 000 cumecs.

Suggest how changes over time in the amount of water stored as ice in the hydrological cycle couldlead to increased river flows.

Suggest how changes over time in the amount of water stored as ice in the hydrological cycle could affect the size of one or more other stores in the hydrological cycle.

Examine the environmental impacts of agriculture on water quality.

The diagram shows some possible water movements in the hydrological cycle.
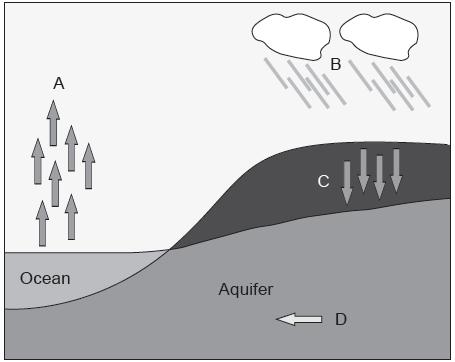

State the four elements of the hydrological cycle labelled A–D.

State two possible methods of artificially recharging the aquifer.

Explain three possible ways people may modify a river channel to increase theflow of water.

To what extent has the management of one major wetland area been successful?
