All topics

The map shows the age of oceanic crust.


Referring to the map, identify the type of plate boundary shown on the map at:
(i) A
(ii) B.

State the age of the oceanic crust at C shown on the map.

Using an annotated diagram only, explain why the age of oceanic crust changes with distance from the mid-ocean ridges.

Referring to specific nations, discuss the geopolitical issues that arise over ocean areas.

The graph below shows the retreat (by altitude) and the surface area of the Santa Rosa glacier in Peru.


Referring to the graph, describe the changes in the terminus of the Santa Rosa glacier from 1970–2000.

Explain the processes involved in the advance and retreat of glaciers.

Discuss the main environmental problems caused by tourism in one extreme environment.

The graph shows the relative strength of El Niño and La Niña events from 1950 to 2016.
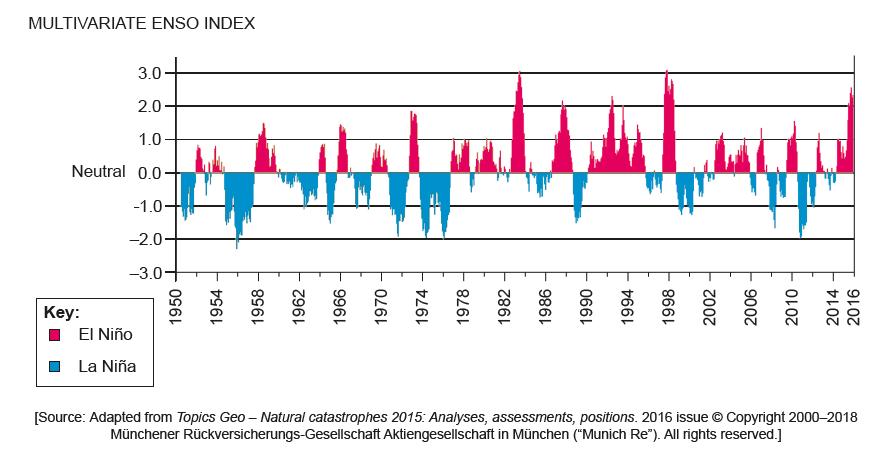

Using information on the graphdescribe the changes in the strength of El Niño events from 1950 to 1998.

Using information on the graph describe changes in the duration of La Niña events from 1950 to 2016.

Explain one economic benefit and one environmental benefit of mangrove swamps.

Examine the relationships between the oceanic sovereignty rights of nations and exclusive economic zones (EEZs).

The photograph shows an area of sand dune restoration.
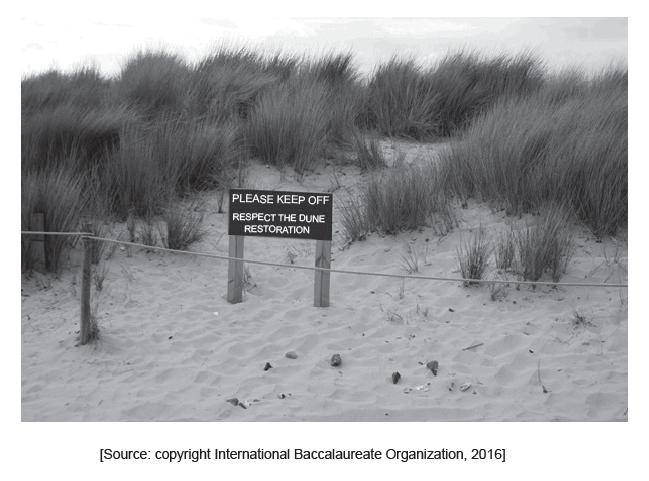

(i) State one natural cause and one human cause of sand dune degradation.
(ii) Identify two ways in which people are attempting to restore the sand dunes shown in the photograph.

Briefly explain the characteristics and formation of two ocean floor landforms found at a constructive plate boundary.

Examine the possible impacts of changes in the ocean carbon store.

Briefly outline the role of oceans as a store of carbon dioxide.

Explain what is meant by the term “oceanic conveyor belt”.

Suggest two reasons why the oceanic conveyor belt is important.

Evaluate the success of one named conservation policy for sustainable fishing.

The graph shows the change in the volume of ice for one glacier from 1850 to 2010.
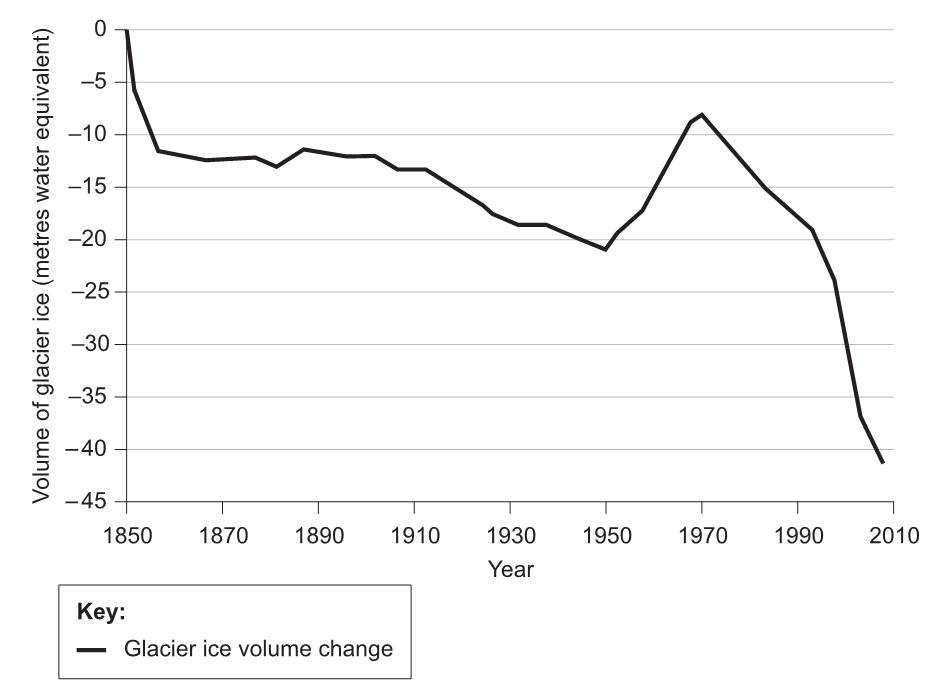

Estimate the volume of ice lost between 1850 and 1950.

State the year when the glacier began a continuous decline lasting to 2010.

Suggest why a short-term increase in glacial ice (positive balance) begins around 1950.

Distinguish between aridity and infertility in hot, arid areas.

Examine the causes and consequences of the melting of permafrost.

The graph shows global trends in marine fish stocks between 1974 and 2014.
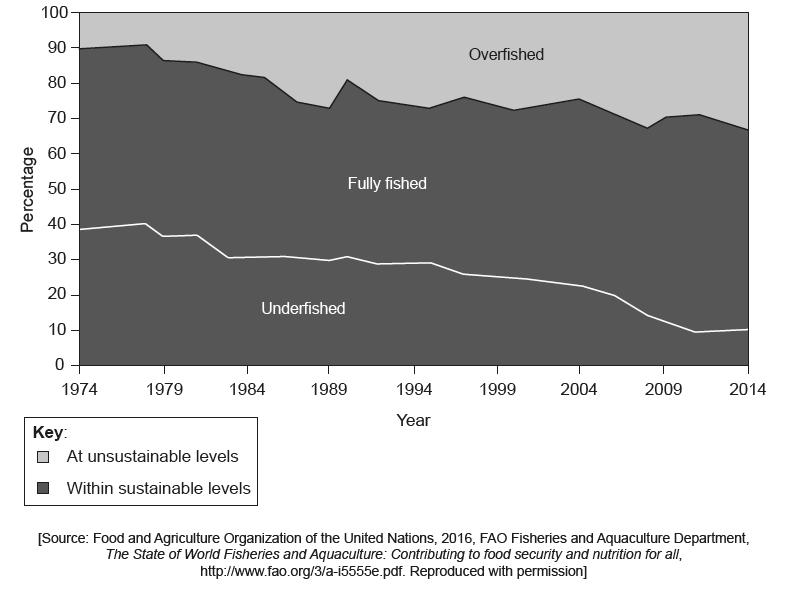

Outline the trend in overfished stocks shown on the graph.

Briefly outline one consequence of overfishing.

Explain the occurrence ofmid-ocean ridges.

Explain the occurrence of ocean trenches.

Evaluate the effectiveness of strategies to manage conflicting human pressures on one named area of coastline.

Describe two characteristics of oceanic crust.

Briefly outline the oceanic circulation in the Pacific Ocean during an El Niño event.

Explain the wind and pressure systems in an El Niño event.

Examine the spatial and temporal consequences of overfishing.
