All topics

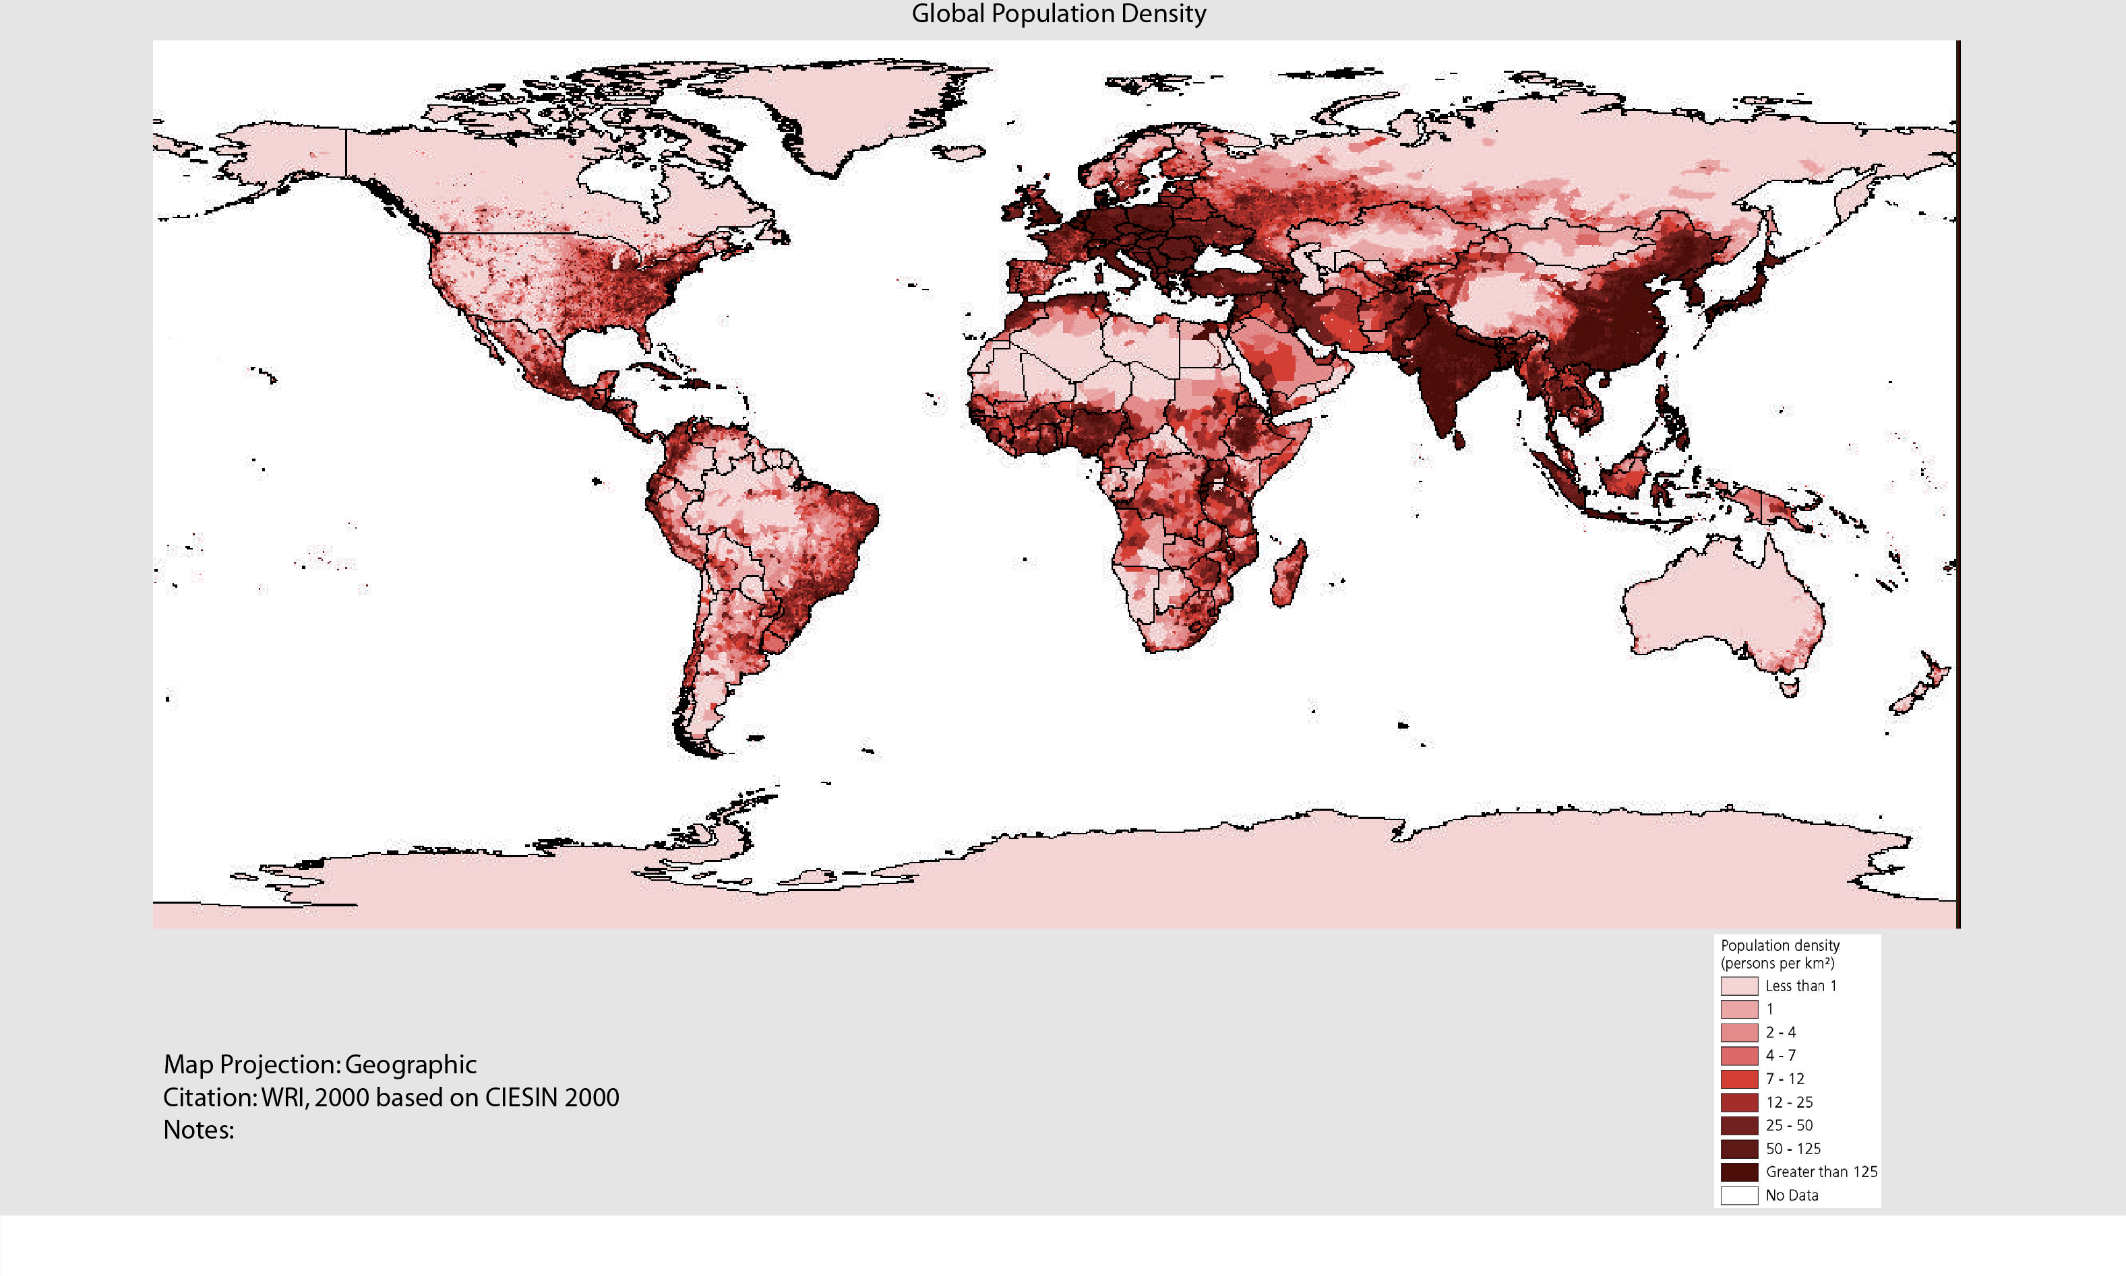
The maps show world population density and the location of hot, arid environments.


Explain how and why the following factors may influence population density in hot, arid areas:

The graph shows the probability (likelihood) of the depth of snow on a ski field being over 1 metre, and over 2 metres, between June and October.


State the earliest date on which there is a 50 % probability of snow depth exceeding 1 metre.

Estimate the probability of snow depth exceeding 2 metres on 1 September.

Briefly explain how the graph provides evidence that this ski field is located in thesouthern hemisphere.

Explain two environmental impacts of tourism in one named extreme environment.

Compare the importance of water and wind in the development of landform features inhot, arid areas.

Briefly outline two human factors that are possible causes of desertification in a hot, arid environment.

Briefly outline two physical factors that influence the occurrence of flash floods in hot, arid environments.

Explain three reasons why there are concentrations of people in some parts of hot, arid areas.

Examine the severity of the different challenges for resource development inperiglacial areas.

The diagram shows a cross-section of the location of permanently frozen ground (permafrost).


Outline how the seasonal changes taking place in the active layer differ between 50°N and 60°N.

Explain two ways in which the active layer creates challenges for settlement and/or communications in a permafrost area.

The diagram shows the proportions of land and water at each degree of latitude and the locations of some cold extreme environments.
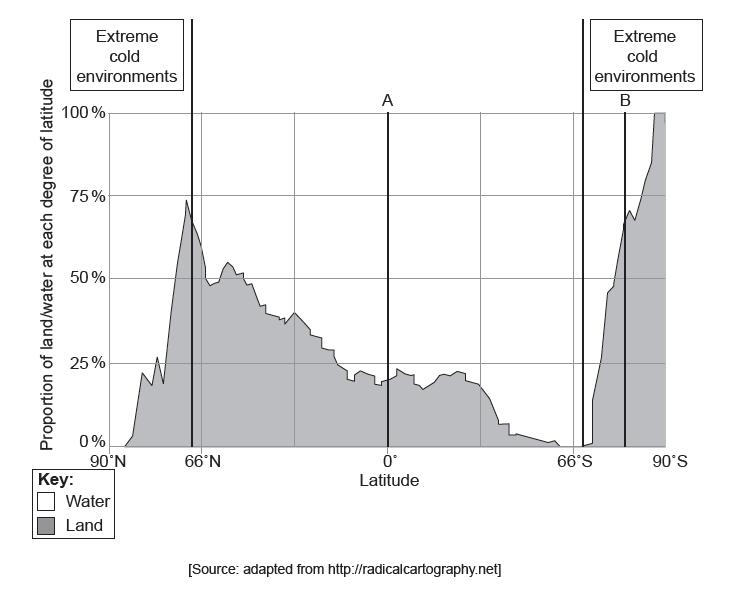

(i) Estimate the latitude at which the percentage of land is highest in the Northern Hemisphere.
(ii) State one reason why extreme cold environments can even be found at latitude

Explain the characteristics and formation in periglacial environments of:
(i) patterned ground;
(ii) thermokarst.

Referring to examples, evaluate the varied economic opportunities in hot, arid environments.

Outline two ways in which people have adapted their outdoor activities to extremes of weather in hot, arid environments.

Distinguish between the terms “accumulation” and “ablation” in the glacial environment.

Explain two reasons why many glaciers are retreating.

“Global climate change will create more opportunities than challenges for indigenous populations.” Discuss this statement, with reference to one or more extreme environments.

The photograph shows part of the Himalaya in the Everest region of Nepal in summer.
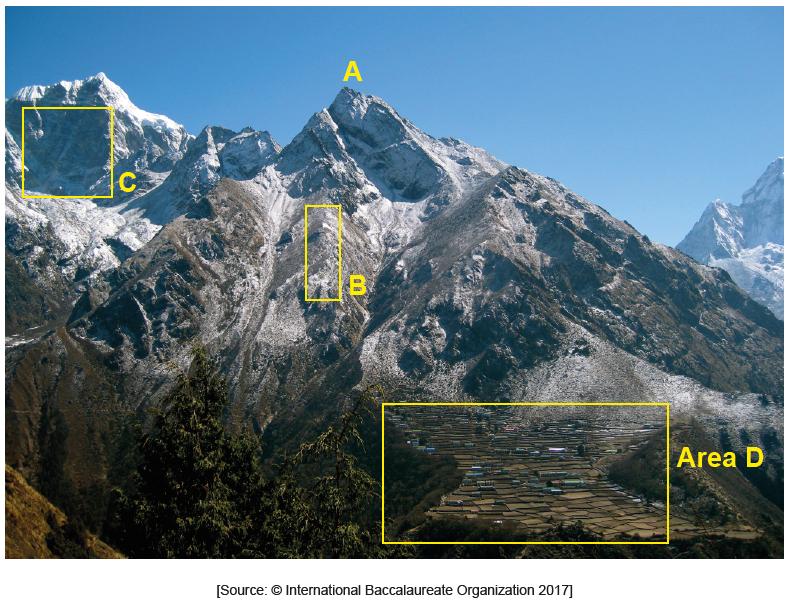

Referring to the photograph, identify landform A and landform B.

Briefly outline how the landform at C was formed.

Explain two possible challenges posed by the environment to the economic activities of people living in areas like area D shown in the photograph.

Examine the opportunities for agriculture in hot, arid areas.

The map extract shows a glaciated area of part of the Lake District in the north-west of England. The scale of the map is 1:25 000. The contour interval is 10 metres. The key for the map extract is below.
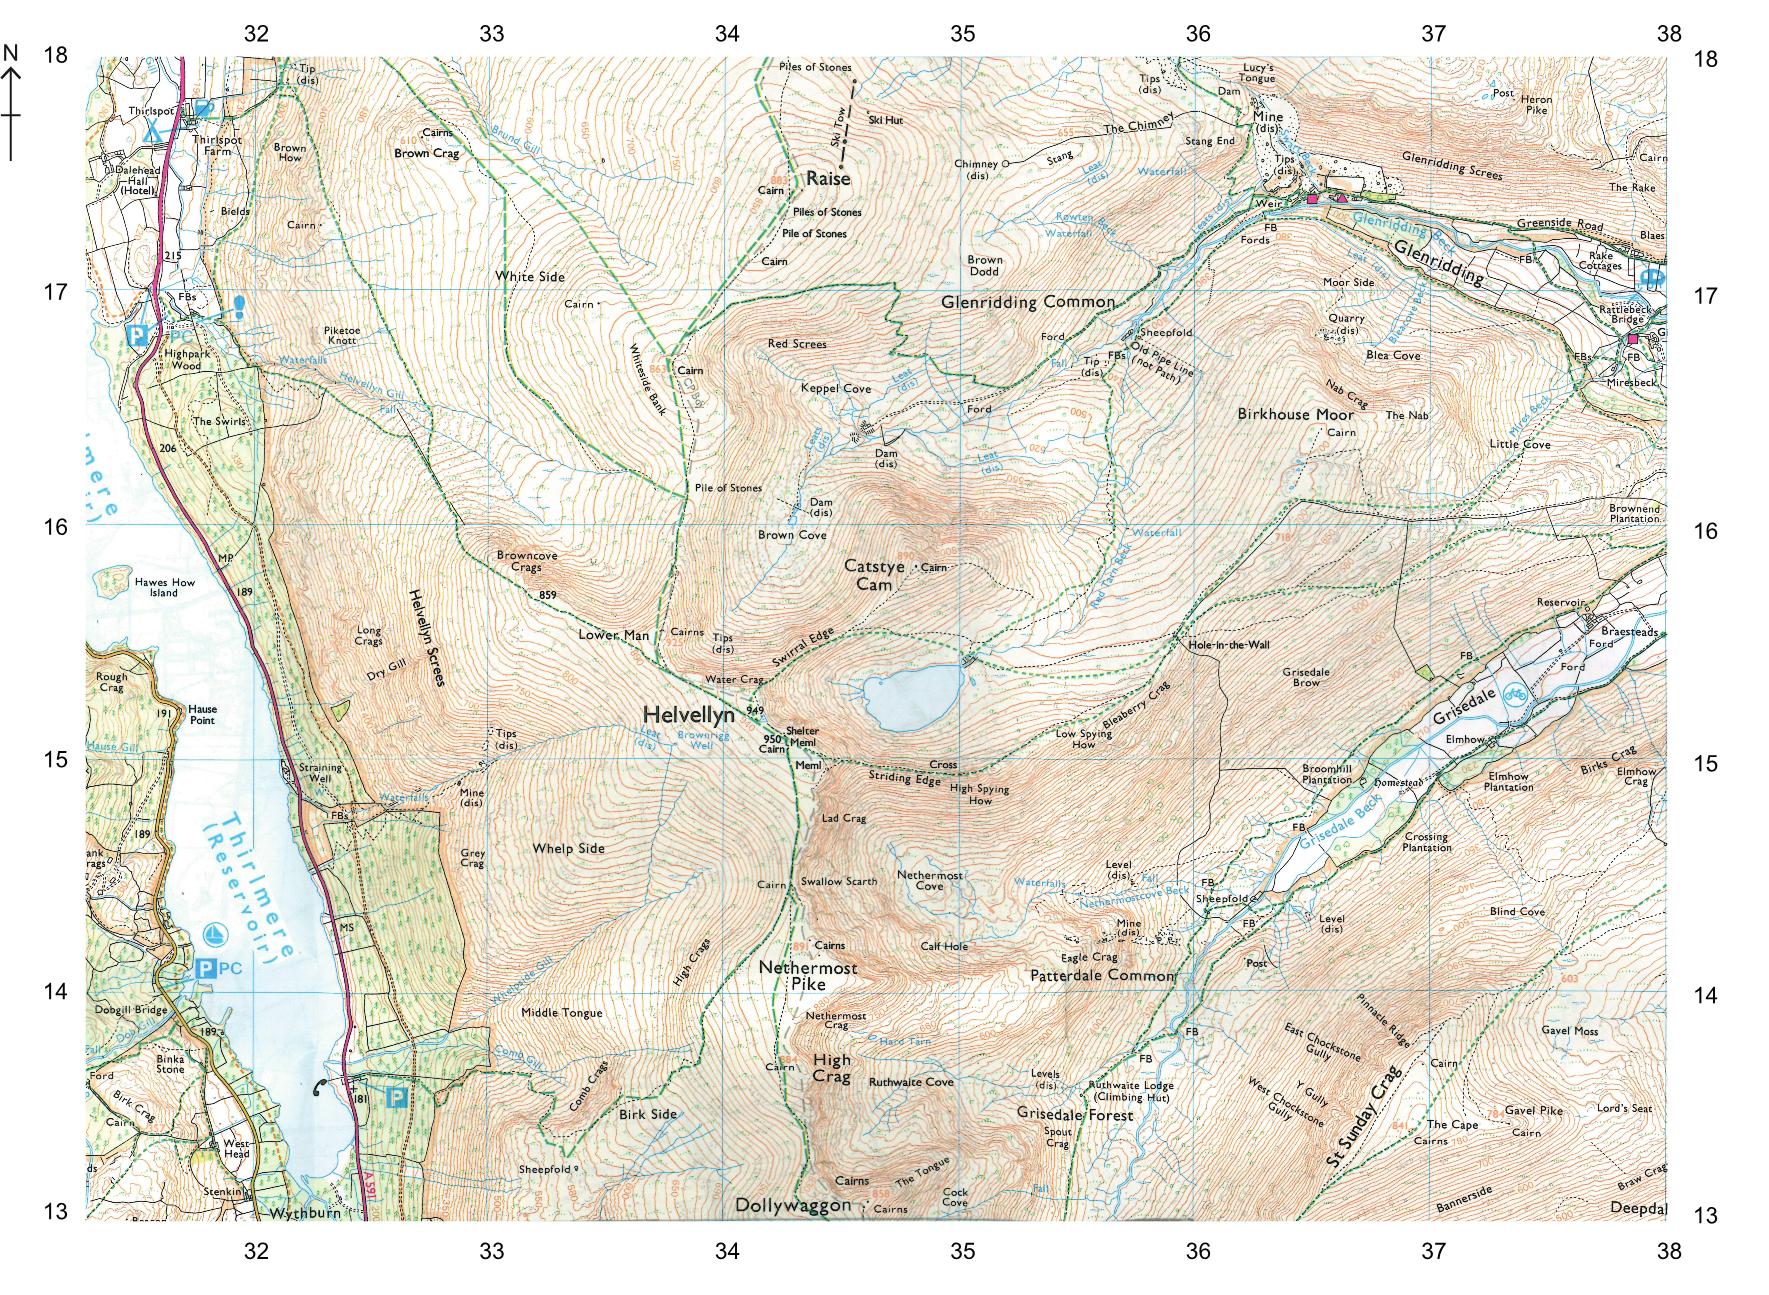
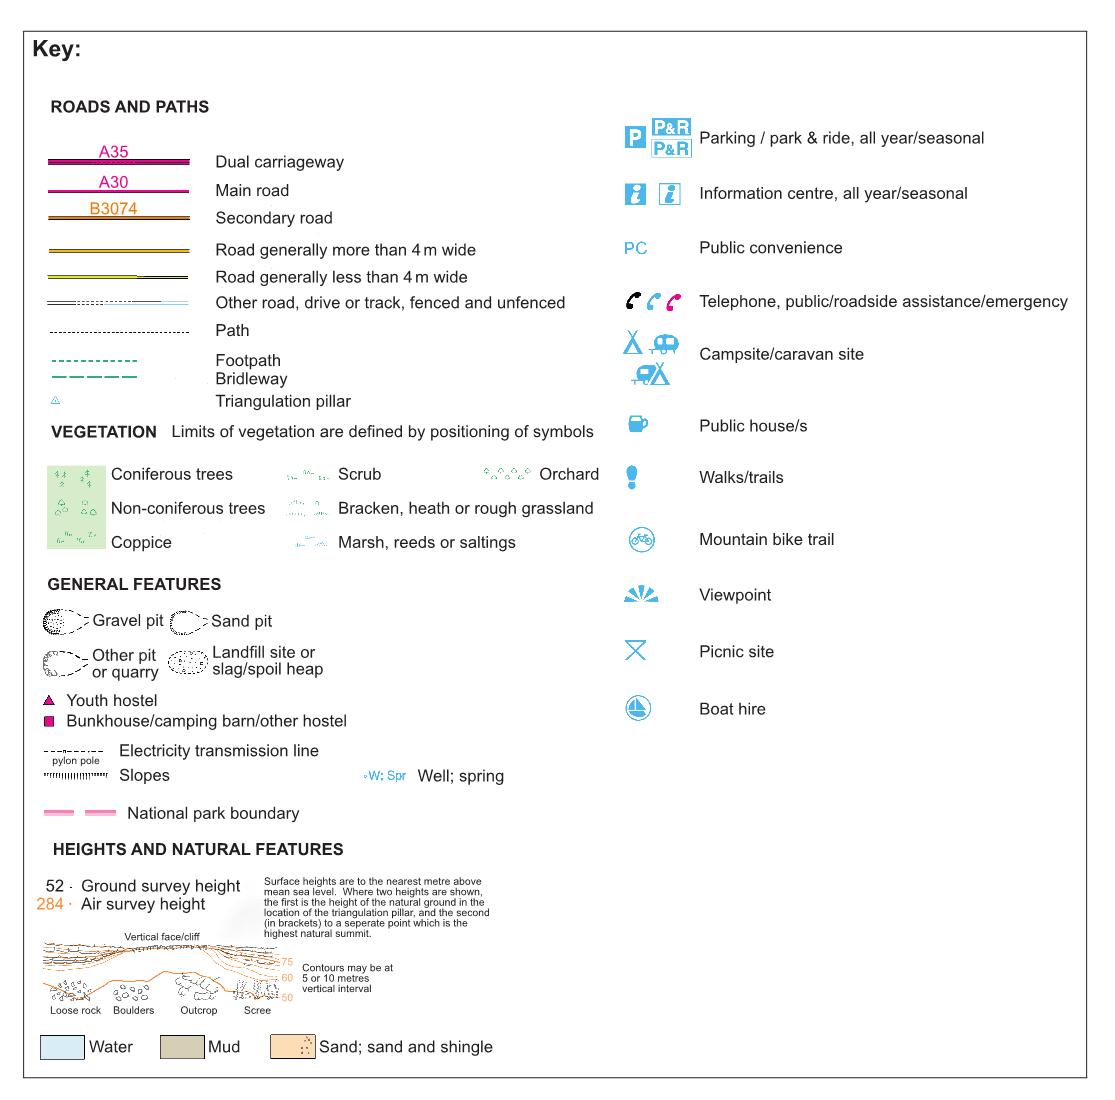

Identify one landform of glacial erosion in square 3415.

State the name of one U-shaped valley/trough shown on the map.

Estimate the length in kilometres of the walking track between the start of the walking track (footpath) at Highpark Wood (3116) to the summit of Helvellyn (3415).

State the height gained from the spot height in square 3315 to the triangulation pillar in square 3415.

Using map evidence, explain one reason, other than climate, why mining in this extreme environment is challenging.

Explain the formation of one feature or landform of glacial deposition.

Examine how the balance between challenges and opportunities affects economic activities in one or more extreme environments.
