All topics

The graph shows the amount of global food aid in millions of tonnes, from 2000 to 2011.
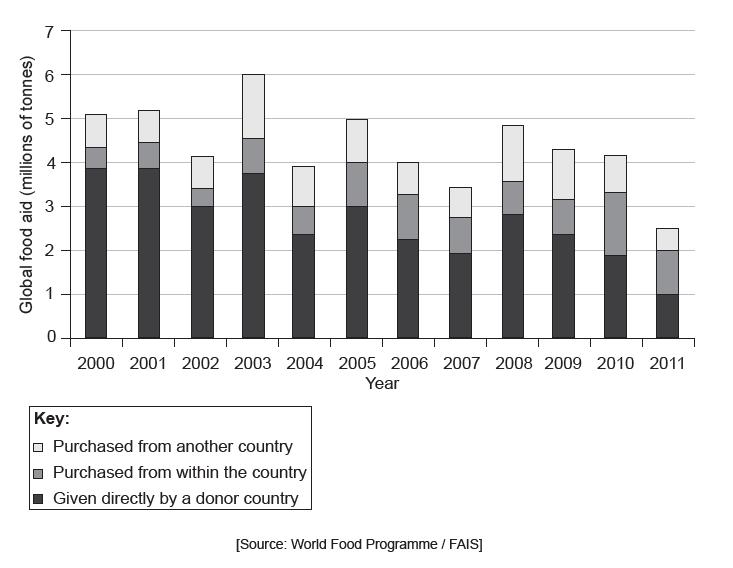

Describe the trends in food aid between 2000 and 2011.

Explain two possible disadvantages of food aid for a community that is currently experiencing food shortages.

“Prevention should always be prioritized over treatment.” Discuss this statement, with reference to specific diseases and communities.

Define the health measure HALE and explain how it differs from life expectancy.
[2+2]

Analyse the advantages and disadvantages of two other indices (other than HALE) used to measure the health of populations.
[3+3]

Discuss the connections between affluence and health.

The map shows the spread of the Zika virus between 1947 and 2016.
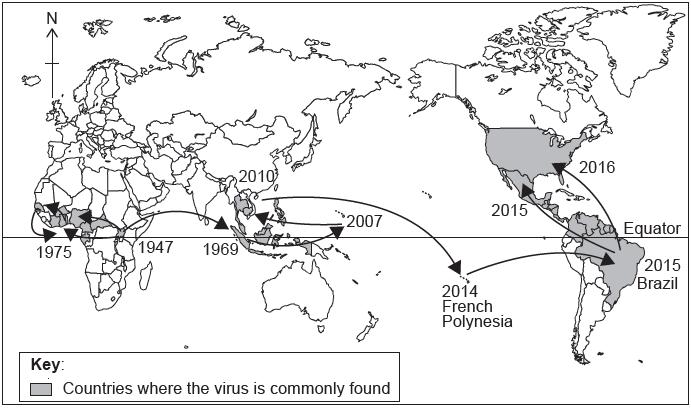

Referring to areas on the map, describe the spread of the Zika virus between1947 and 2010.

State what type of diffusion accounts for the spread of the Zika virus from FrenchPolynesia to Brazil.

Explain three health improvements that have led to an increase in life expectancy inmany low-income countries in recent years.

Examine the strengths and limitations of the energy efficiency ratio as an indicator ofsustainable agriculture.

State two diseases of poverty.

Describe the distribution of diseases of poverty.

Explain two types of diffusion in relation to the spread of disease.

To what extent have recent changes in agriculture increased the production and availability of food in low-income countries?

Explain how one environmental factor and one political factor can lead to a decline in food production.

Examine the geographic factors responsible for the incidence and transmission of one named disease (vector-borne, water-borne or sexually transmitted).

Describe the relationship between GDP (gross domestic product) per capita and life expectancy.

Outline one advantage of using HALE as a measure of a population’s health.

Explain how one natural barrier and one political barrier might limit the spread of disease.

Examine the impacts of international trade agreements and trade barriers on the availability of food in some countries.

Outline one way in which the health of a population can be affected by chronic hunger.

The diagrams show the average daily consumption of calories per person.
* Rich and Poor countries according to FAO classification

Outline two differences between calorie consumption in rich countries and poor countries in 2000.

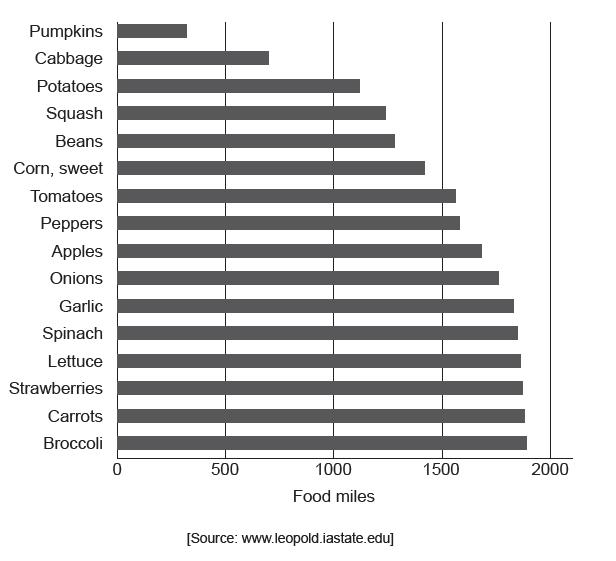
The graph shows the food miles for fruit and vegetables supplied to institutions in the state of Iowa, USA.

(i) Define the term food miles.
(ii) State the fruit or vegetable that ranks sixth in terms of the highest number of food miles.
(iii) Estimate the average (mean) food miles for the fruit and vegetables shown in the graph above.

Suggest one advantage and two disadvantages of using food miles as an indicator of the environmental impacts associated with food production.

To what extent are food availability, malnutrition and diseases of poverty connected with one another?

The map shows the life expectancy at birth for countries other than those in the Americas.
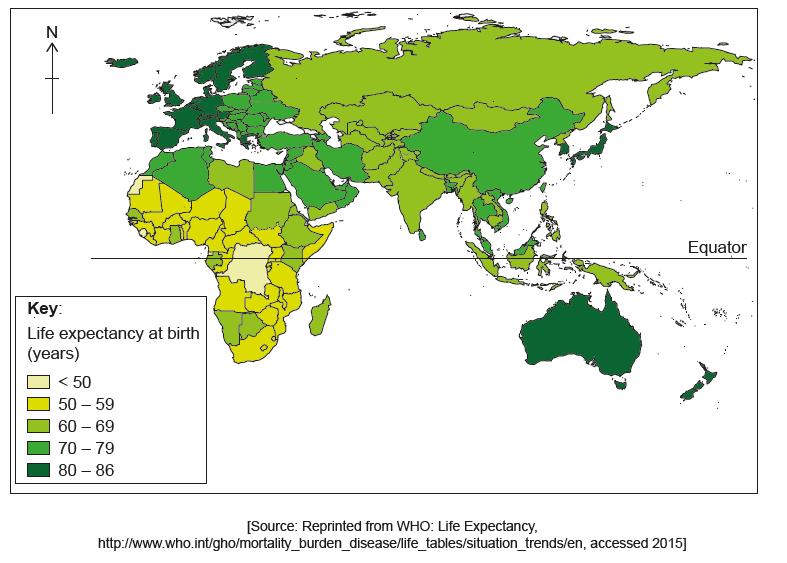

Describe the pattern of life expectancy shown on the map.

Explain three indicators, other than life expectancy, which can be used to measure the health of the population in a country.

“Food miles are an excellent indicator of the environmental impact of agriculture.” Discuss this statement.
