Question
HLPaper 1A
The graph shows the effect of substrate concentration on the rate of an enzyme-catalysed reaction with and without an inhibitor.
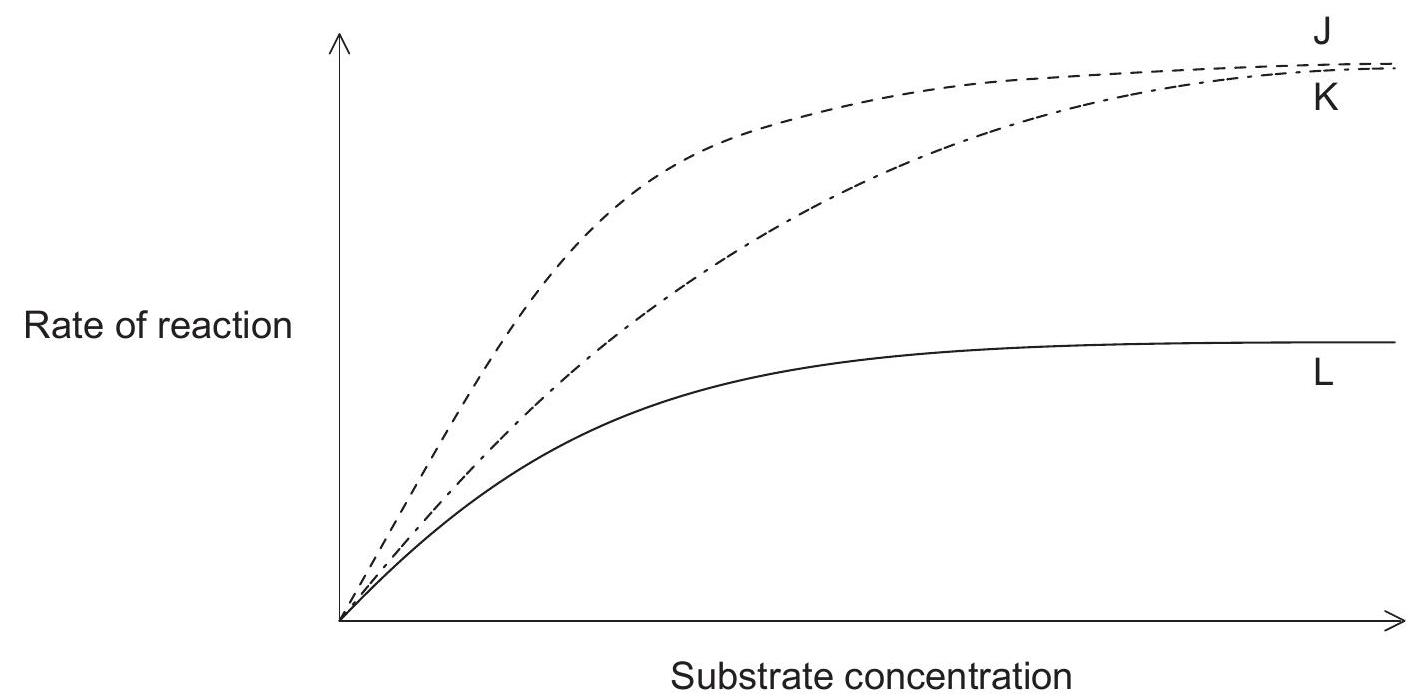
What do the curves J, K and L on the graph indicate?
| Competitive inhibitor | Non-competitive inhibitor | Normal enzyme activity | |
|---|---|---|---|
| A. | J | K | L |
| B. | K | L | J |
| C. | L | J | K |
| D. | L | K | J |

