
Topic 0 - All Geography Topics
Question 1
SL & HLPaper 2The maps show world population density and the location of hot, arid environments.

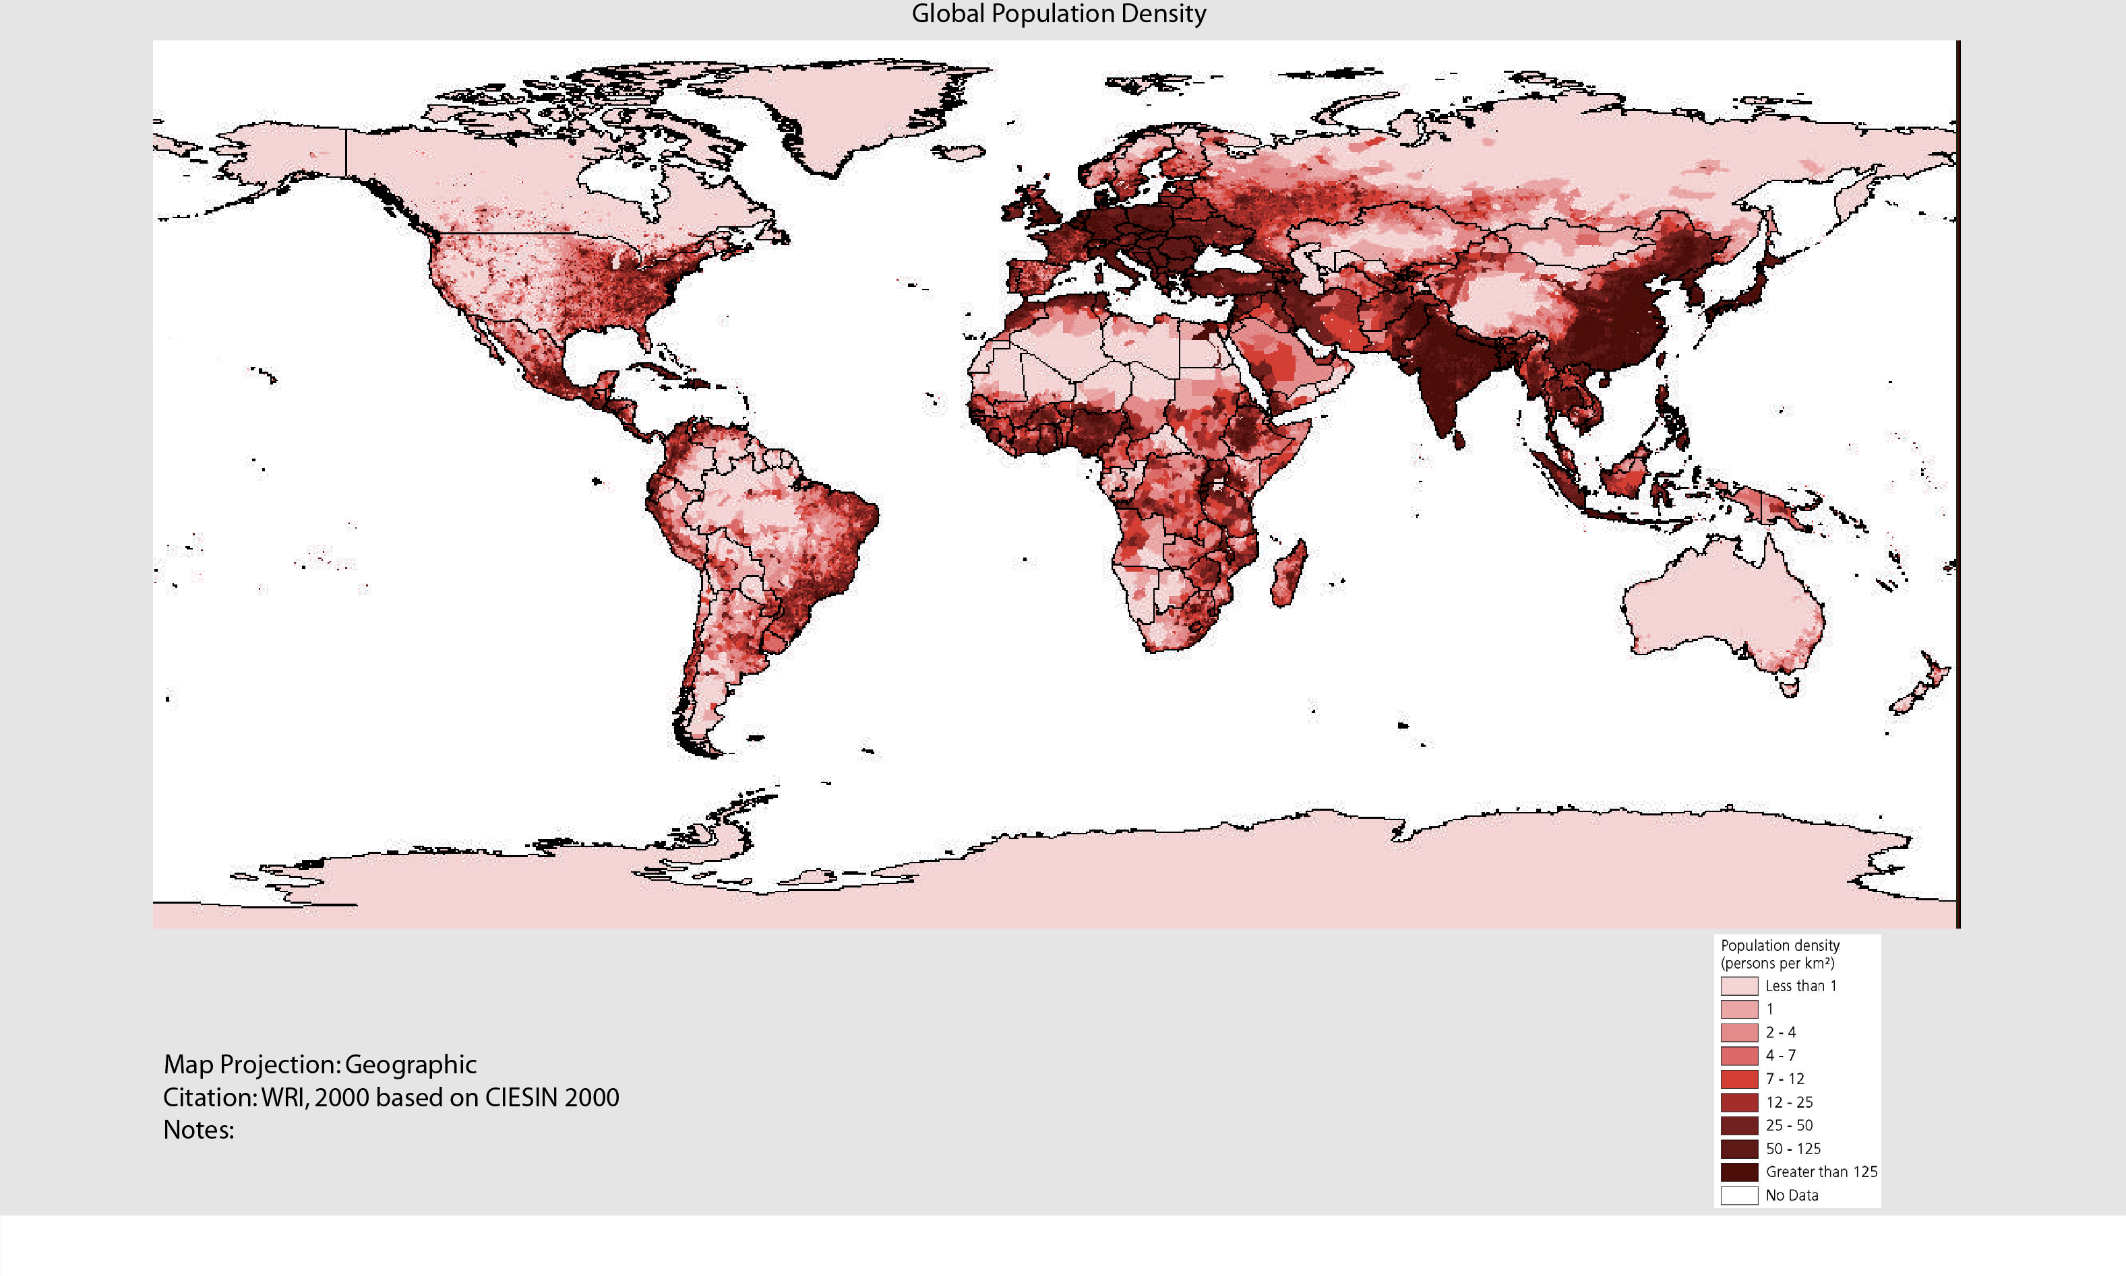
Using the two maps, describe the population density in hot, arid areas.
Explain how and why the following factors may influence population density in hot, arid areas:
- human discomfort,
- inaccessibility.
Using examples, examine how extreme environments offer both challenges and opportunities for mineral extraction.
Question 2
SL & HLPaper 2Explain two strengths and one weakness of one named city’s attempt to reduce urban pollution.
Examine the effects of the movement of economic activity to derelict land such as brownfield sites.
Question 3
SL & HLPaper 2Using two different examples, outline what is meant by:
(i) the catchment area of recreation and sports facilities;
(ii) the range of recreation and sports facilities.
Explain two management strategies to reduce environmental damage from tourism in one named rural area.
Examine the relative importance of factors influencing the distribution of sports facilities in one or more named urban areas.
Question 4
SL & HLPaper 2The graph shows the probability (likelihood) of the depth of snow on a ski field being over1 metre, and over 2 metres, between June and October.

State the earliest date on which there is a 50 % probability of snow depthexceeding 1 metre.
Estimate the probability of snow depth exceeding 2 metres on 1 September.
Briefly explain how the graph provides evidence that this ski field is located in thesouthern hemisphere.
Explain two environmental impacts of tourism in one named extreme environment.
Compare the importance of water and wind in the development of landform features inhot, arid areas.
Question 5
SL & HLPaper 2The diagram shows the hierarchy of open spaces serving a city.

Referring to the diagram, outline two differences you would expect to find between “local parks and open spaces” and a “country park”.
[2+2]
Explain three reasons why it is important for city planners to ensure that there are sufficient open spaces for urban residents.
With reference to a named urban area, examine the factors that have influenced the location and distribution of leisure facilities, other than open spaces.
Question 6
SL & HLPaper 2Briefly outline two human factors that are possible causes of desertification in ahot, arid environment.
Briefly outline two physical factors that influence the occurrence of flash floodsin hot, arid environments.
Explain three reasons why there are concentrations of people in some parts of hot,arid areas.
Examine the severity of the different challenges for resource development inperiglacial areas.
Question 7
SL & HLPaper 2The graph shows the amount of global food aid in millions of tonnes, from 2000 to 2011.
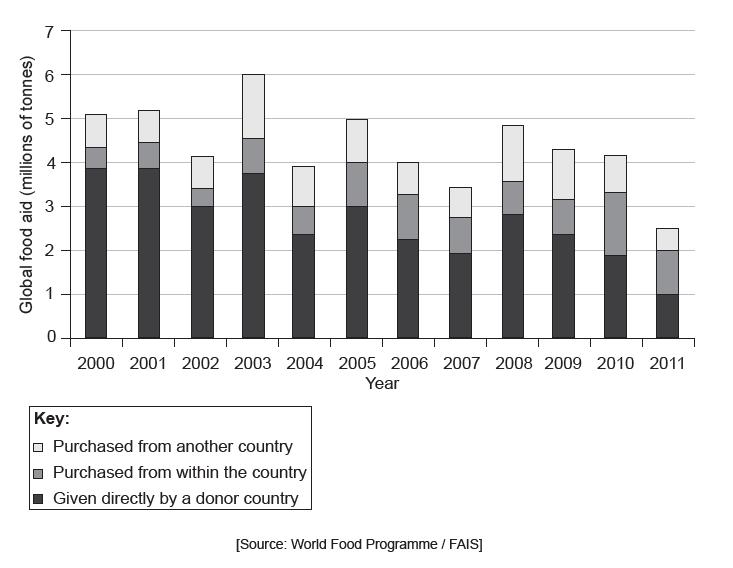
Describe the trends in food aid between 2000 and 2011.
Explain two possible disadvantages of food aid for a community that is currently experiencing food shortages.
“Prevention should always be prioritized over treatment.” Discuss this statement, with reference to specific diseases and communities.
Question 8
SL & HLPaper 2Define the term tourism.
State two possible reasons why not all international arrivals can be classified astourists.
Explain two strategies designed to manage the environmental damage caused bytourism in one named large town or city.
Discuss the view that the economic benefits of tourism in one country you have studiedoutweigh its negative social and environmental impacts.
Question 9
SL & HLPaper 2The diagram shows a cross-section of the location of permanently frozen ground (permafrost).

Describe how the characteristics of permafrost vary with latitude.
Outline how the seasonal changes taking place in the active layer differ between 50°N and 60°N.
Explain two ways in which the active layer creates challenges for settlement and/or communications in a permafrost area.
“The opportunities for mineral extraction outweigh the challenges in hot, arid areas.” Discuss this statement.
Question 10
SL & HLPaper 2The map shows the age of oceanic crust.

Referring to the map, identify the type of plate boundary shown on the map at:
(i) A
(ii) B.
State the age of the oceanic crust at C shown on the map.
Using an annotated diagram only, explain why the age of oceanic crust changes with distance from the mid-ocean ridges.
Referring to specific nations, discuss the geopolitical issues that arise over ocean areas.
