All topics

Below is an image of a coastal tourist destination.

Describe how the tourist activities at this coastal destination have changed overtime.

The graph below shows tourist arrivals in South Africa from 2012 - 2023.

Describe the pattern of tourist arrivals from 2012 - 2023.

Explain why there are greater tourist arrivals in 2023 than there were in 2012.

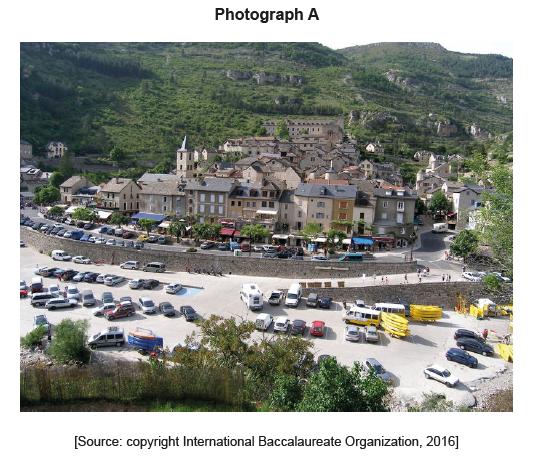
The map shows the area around the valley of the River Tarn and the town of Sainte-Enimie in Southern France. The scale is 1:100 000 and the contour interval is 40 metres. Photograph A shows the town of Sainte-Enimie.
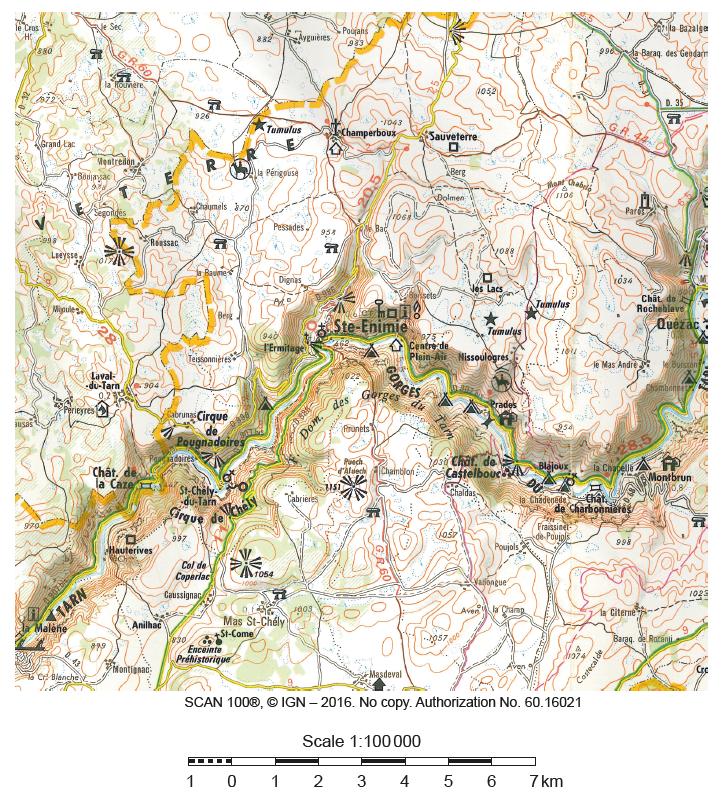

Using map evidence, identify and locate two secondary tourist resources.

Describe how one characteristic of the valley of the River Tarn limits its environmental carrying capacity.

(i) State the direction in which the camera was pointing when photograph A was taken.
(ii) Referring to photograph A, suggest the evidence that the perceptual carrying capacity of Sainte-Enimie may already have been exceeded.

Using examples, evaluate the use of tourism as a development strategy in some low-income countries.

Suggest two reasons why some urban areas with high population density might have fewer leisure facilities than expected.

Explain how the provision of leisure facilities can impact the quality of life in urban areas.

Evaluate the role of public and private sectors in the provision of leisure facilities in urban areas.

Analyze the potential challenges urban planners face when trying to increase the number of leisure facilities in high-density areas.

The graph below shows the number of tourists in Acapulco between 1920 and 2010.

Between what years was the greatest rise in tourism.

Describe how the number of tourists has changed from 1920-2010.

Below shows an island in the Indian ocean before and after tourism development.

Explain how economic development led to the tourism development on the island.

Outline why more people are able to travel to tourist destinations like this island, now than ever before.

Urban areas vary in their population density and the number of leisure facilities they offer. These factors can have significant impacts on the quality of life for residents.

Describe the general relationship between the number of leisure facilities and population density in urban areas.

Suggest two possible reasons why urban areas with higher population densities often have more leisure facilities.

Explain why some urban areas might have a high population density but a relatively low number of leisure facilities, contrary to the general trend.

Discuss the impact of the distribution of leisure facilities on the quality of life in urban areas.
