All topics

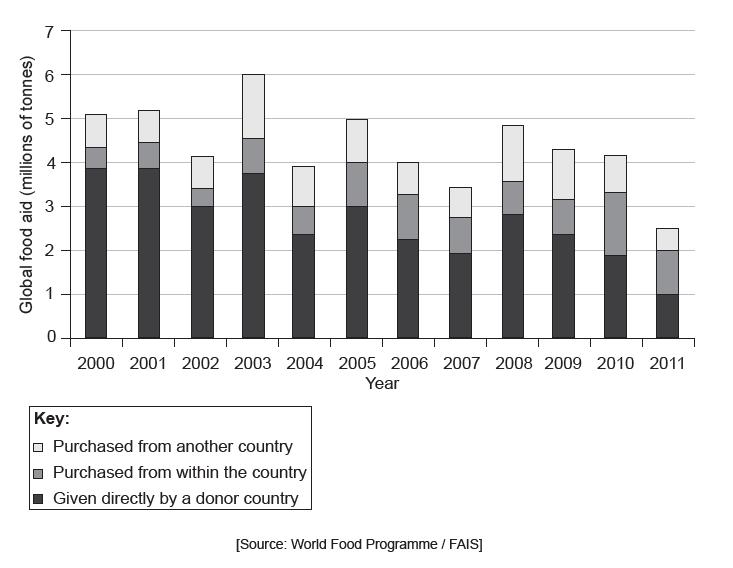
The graph shows the amount of global food aid in millions of tonnes, from 2000 to 2011.

Explain two possible disadvantages of food aid for a community that is currently experiencing food shortages.

“Prevention should always be prioritized over treatment.” Discuss this statement, with reference to specific diseases and communities.

Describe the trends in food aid between 2000 and 2011.

Examine the geographic factors responsible for the incidence and transmission of one named disease (vector-borne, water-borne or sexually transmitted).

Explain how one ecological factor and one governmental factor can lead to a decline in food production.

Outline one way in which the well-being of a community can be affected by persistent hunger.

The graph shows the mortality rates for children under the age of five for world regions between 1990 and 2015.
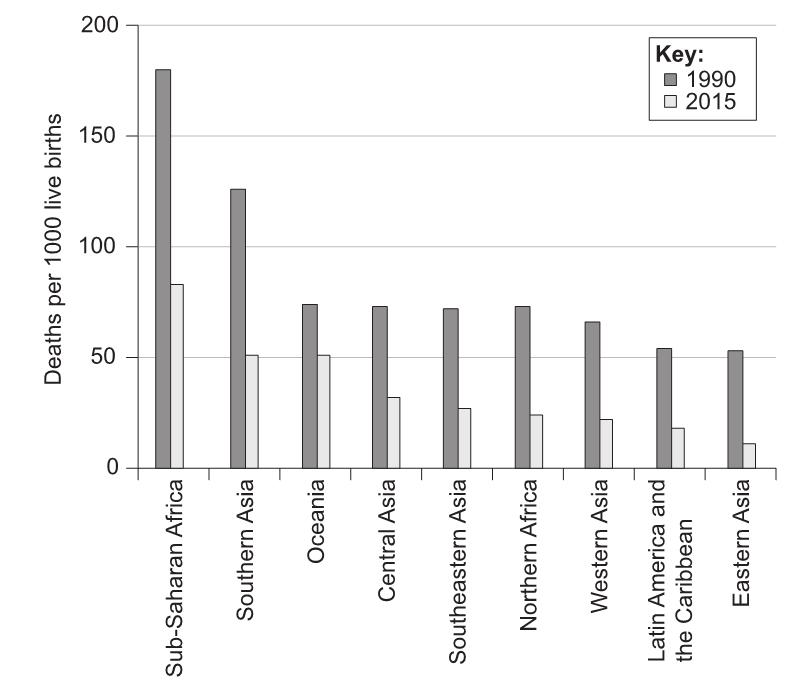

Describe the changes in Sub-Saharan Africa between 1990 and 2015.

Identify the region with the greatest relative change in mortality rate between 1990 and 2015.

Outline why HALE is a better indicator of a nation’s health than child mortality.

Explain how the application of two named barriers to limit the spread of disease has reduced child mortality rates.

Evaluate the relative importance of fair trade and food aid in overcoming food shortages in low-income countries.

The diagrams show the average daily consumption of calories per person.
* Rich and Poor countries according to FAO classification

Outline two differences between calorie consumption in rich countries and poor countries in 2000.
