Which graph shows a line where each value of is three more than half of ? 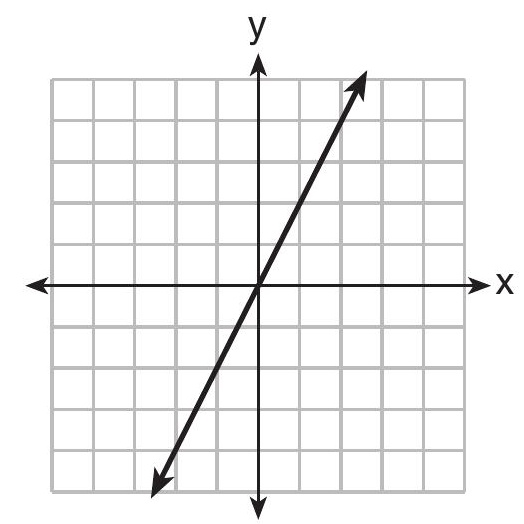

A bookstore owner recorded the number of books sold and the profit made selling the books.
| Books Sold | Profit |
|---|---|
| 100 | $ 50.00 |
| 250 | $ 275.00 |
| 300 | $ 350.00 |
| 350 | $ 425.00 |
What is the average rate of change, in dollars per book, between 100 and 350 books sold?

The table below shows the number of hours ten students spent studying for a test and their scores.
| Hours Spent Studying (x) | 0 | 1 | 2 | 4 | 4 | 4 | 6 | 6 | 7 | 8 |
|---|---|---|---|---|---|---|---|---|---|---|
| Test Scores | 35 | 40 | 46 | 65 | 67 | 70 | 82 | 88 | 82 | 95 |
Write the linear regression equation for this data set. Round all values to the nearest hundredth.
State the correlation coefficient of this line, to the nearest hundredth.
Explain what the correlation coefficient suggests in the context of the problem.

Write the linear regression equation for this data set. Round all values to the nearest hundredth.

State the correlation coefficient of this line, to the nearest hundredth.

Explain what the correlation coefficient suggests in the context of the problem.

Erica, the manager at Stellarbeans, collected data on the daily high temperature and revenue from coffee sales. Data from nine days this past fall are shown in the table below.
| Day 1 | Day 2 | Day 3 | Day 4 | Day 5 | Day 6 | Day 7 | Day 8 | Day 9 | |
|---|---|---|---|---|---|---|---|---|---|
| High Temperature, t | 54 | 50 | 62 | 67 | 70 | 58 | 52 | 46 | 48 |
| Coffee Sales, | \ 2900$ | \ 3080$ | \ 2500$ | \ 2380$ | \ 2200$ | \ 2700$ | \ 3000$ | \ 3620$ | \ 3720$ |
State the linear regression function, , that estimates the day's coffee sales with a high temperature of . Round all values to the nearest integer.
State the correlation coefficient, , of the data to the nearest hundredth. Does indicate a strong linear relationship between the variables? Explain your reasoning.

State the linear regression function .

State the correlation coefficient and explain its significance.

The table below shows 6 students' overall averages and their averages in their math class.
| Overall Student Average | 92 | 98 | 84 | 80 | 75 | 82 |
|---|---|---|---|---|---|---|
| Math Class Average | 91 | 95 | 85 | 85 | 75 | 78 |
If a linear model is applied to these data, which statement best describes the correlation coefficient?

The following table represents a sample of sale prices, in thousands of dollars, and number of new homes available at that price in 2017.
| Sale Price, (in thousands of dollars) | 160 | 180 | 200 | 220 | 240 | 260 | 280 |
|---|---|---|---|---|---|---|---|
| Number of New Homes Available | 126 | 103 | 82 | 75 | 82 | 40 | 20 |
State the linear regression function, , that estimates the number of new homes available at a specific sale price, . Round all values to the nearest hundredth. State the correlation coefficient of the data to the nearest hundredth. Explain what this means in the context of the problem.

State the linear regression function, , that estimates the number of new homes available at a specific sale price, . Round all values to the nearest hundredth.

State the correlation coefficient of the data to the nearest hundredth. Explain what this means in the context of the problem.

Which ordered pair does not fall on the line formed by the other three?

The following table represents a sample of sale prices, in thousands of dollars, and number of new homes available at that price in 2017.
| Sale Price, p (in thousands of dollars) | 160 | 180 | 200 | 220 | 240 | 260 | 280 |
|---|---|---|---|---|---|---|---|
| Number of New Homes Available | 126 | 103 | 82 | 75 | 82 | 40 | 20 |
State the linear regression function, , that estimates the number of new homes available at a specific sale price, . Round all values to the nearest hundredth.
State the correlation coefficient of the data to the nearest hundredth. Explain what this means in the context of the problem.

State the linear regression function, , that estimates the number of new homes available at a specific sale price, . Round all values to the nearest hundredth.

State the correlation coefficient of the data to the nearest hundredth. Explain what this means in the context of the problem.

One Saturday afternoon, three friends decided to keep track of the number of text messages they received each hour from 8 a.m. to noon. The results are shown below.
Emily said that the number of messages she received increased by 8 each hour.
Jessica said that the number of messages she received doubled every hour.
Chris said that he received 3 messages the first hour, 10 the second hour, none the third hour, and 15 the last hour.
Which of the friends' responses best classifies the number of messages they received each hour as a linear function?

Given the graph of the line represented by the equation , if is increased by 4 units, the graph of the new line would be shifted 4 units
