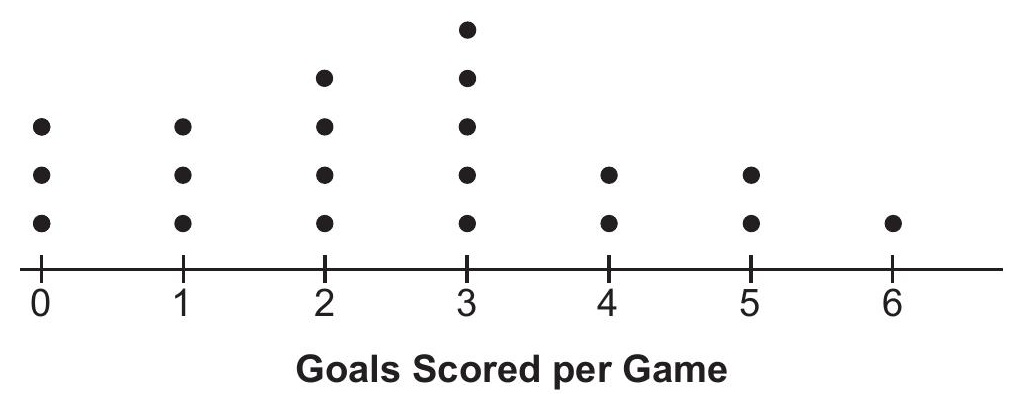
The dot plot below shows the number of goals Jessica scored in each lacrosse game last season.
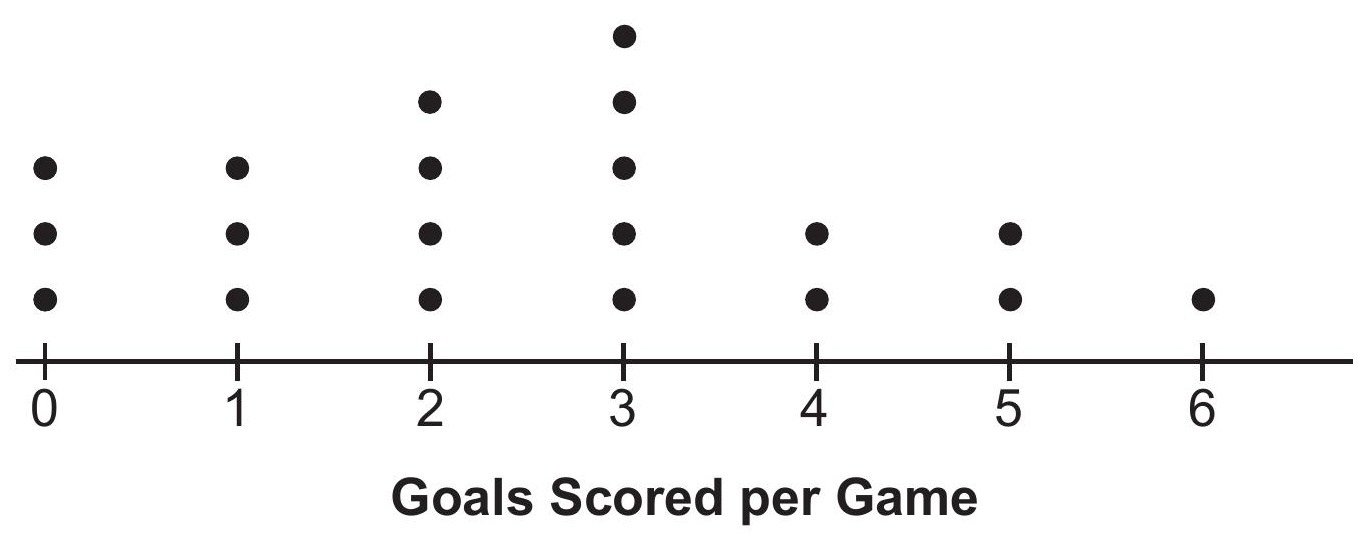
Which statement about the dot plot is correct?

Students were asked to name their favorite sport from a list of basketball, soccer, or tennis. The results are shown in the table below.
| Basketball | Soccer | Tennis | |
|---|---|---|---|
| Girls | 42 | 58 | 20 |
| Boys | 84 | 41 | 5 |
What percentage of the students chose soccer as their favorite sport?

Which graph shows a line where each value of is three more than half of ? 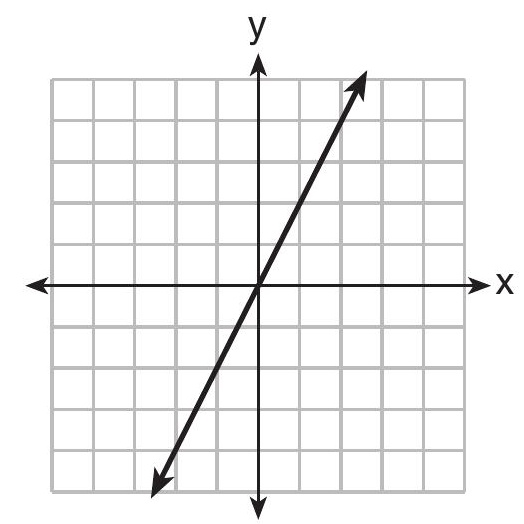

A bookstore owner recorded the number of books sold and the profit made selling the books.
| Books Sold | Profit |
|---|---|
| 100 | $ 50.00 |
| 250 | $ 275.00 |
| 300 | $ 350.00 |
| 350 | $ 425.00 |
What is the average rate of change, in dollars per book, between 100 and 350 books sold?

28 The graph below shows the variation in the average temperature of Earth's surface from 1950-2000, according to one source. 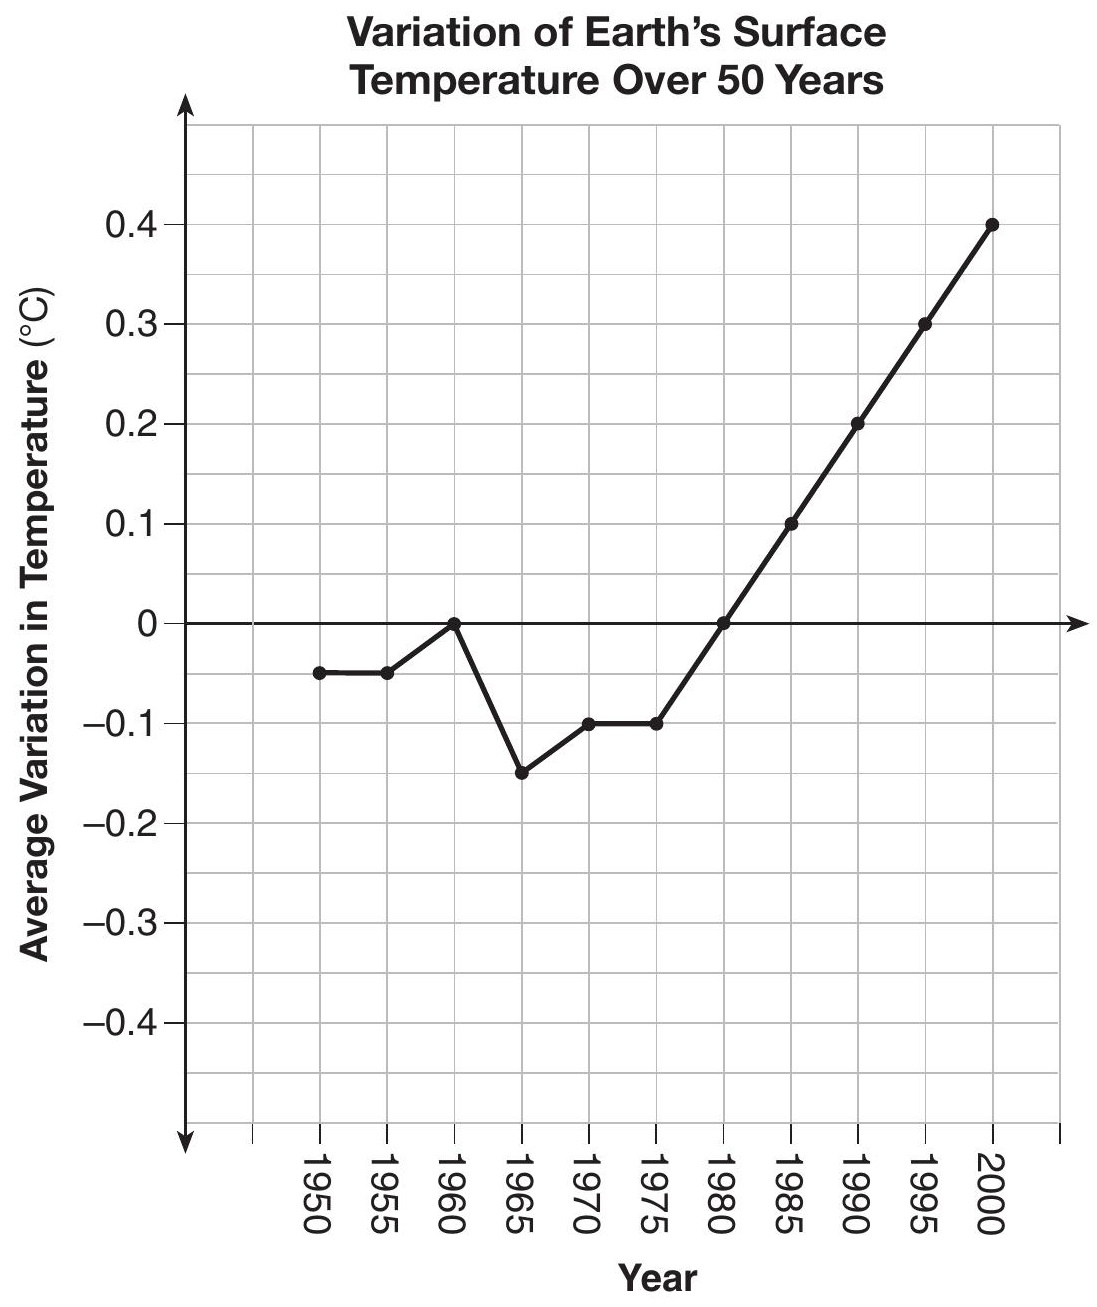 During which years did the temperature variation change the most per unit time? Explain how you determined your answer.

During which years did the temperature variation change the most per unit time? Explain how you determined your answer.

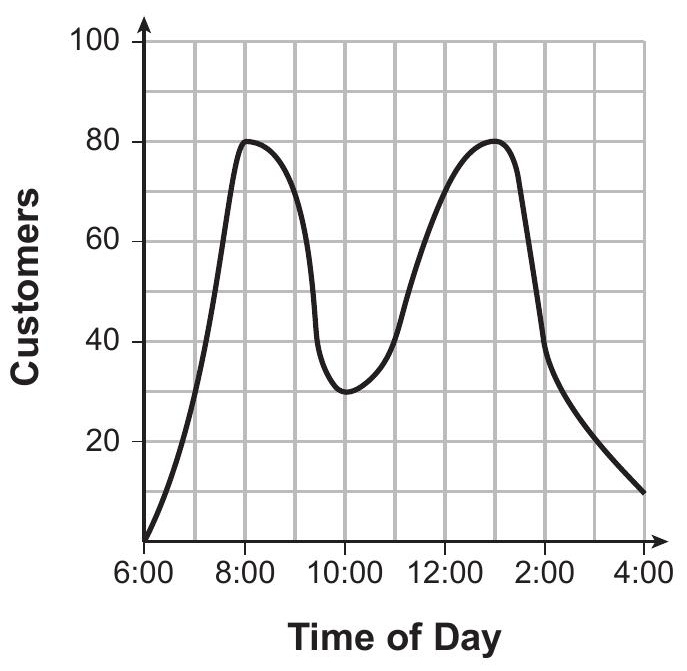
A café owner tracks the number of customers during business hours. The graph below models the data.
Based on the graph, the café owner saw a continual

Noah conducted a survey on sports participation. He created the following two dot plots to represent the number of students participating, by age, in soccer and basketball.
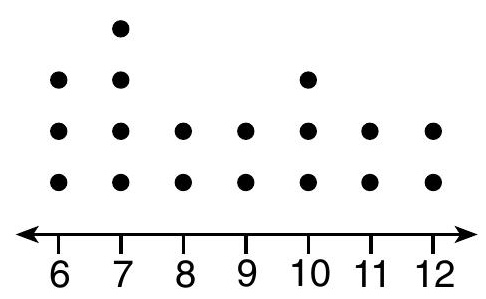
Soccer Players' Ages
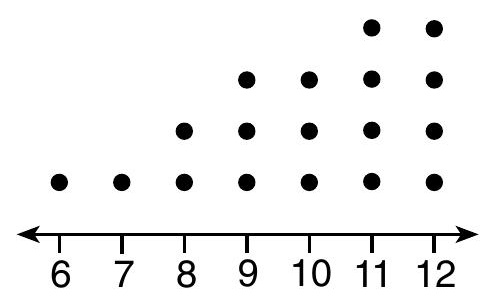
Basketball Players' Ages
Which statement about the given data sets is correct?

The table below shows the number of hours ten students spent studying for a test and their scores.
| Hours Spent Studying (x) | 0 | 1 | 2 | 4 | 4 | 4 | 6 | 6 | 7 | 8 |
|---|---|---|---|---|---|---|---|---|---|---|
| Test Scores | 35 | 40 | 46 | 65 | 67 | 70 | 82 | 88 | 82 | 95 |
Write the linear regression equation for this data set. Round all values to the nearest hundredth.
State the correlation coefficient of this line, to the nearest hundredth.
Explain what the correlation coefficient suggests in the context of the problem.

Write the linear regression equation for this data set. Round all values to the nearest hundredth.

State the correlation coefficient of this line, to the nearest hundredth.

Explain what the correlation coefficient suggests in the context of the problem.

Some adults were surveyed to find out if they would prefer to buy a sports utility vehicle (SUV) or a sports car. The results of the survey are summarized in the table below.
| SUV | Sports Car | Totals | |
|---|---|---|---|
| Male | 21 | 38 | 59 |
| Female | 135 | 46 | 181 |
| Totals | 156 | 84 | 240 |
Of the number of adults that preferred sports cars, approximately what percent were males?

The dot plot below shows the number of goals Jessica scored in each lacrosse game last season.
Which statement about the dot plot is correct?
