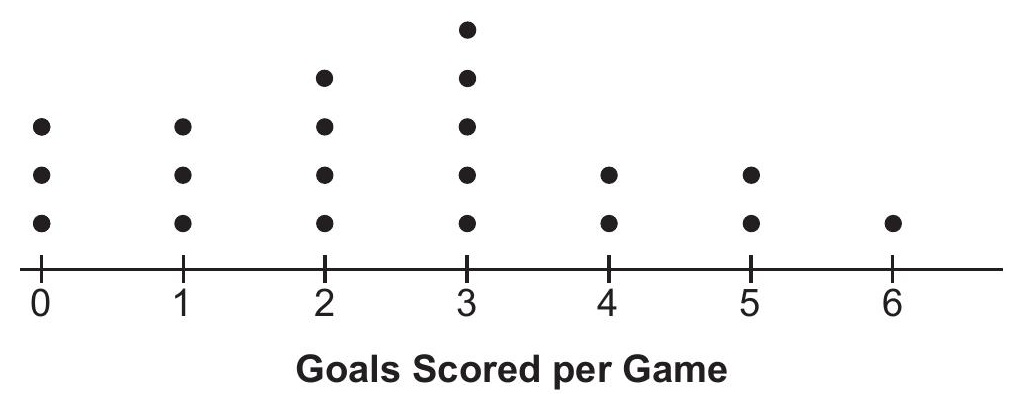
The dot plot below shows the number of goals Jessica scored in each lacrosse game last season.
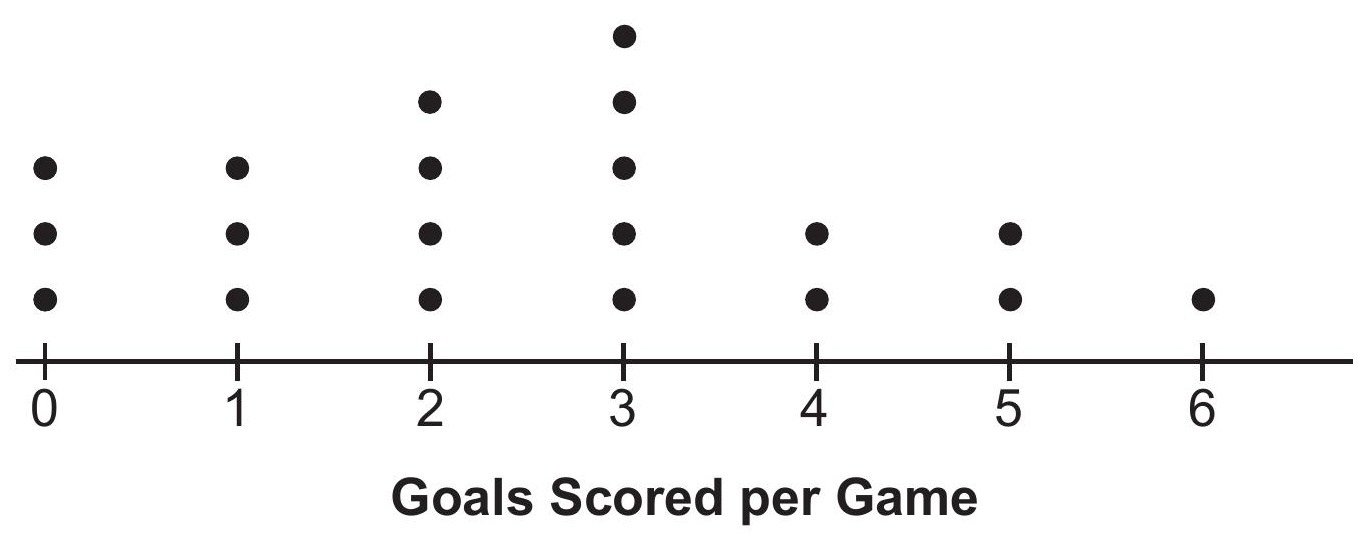
Which statement about the dot plot is correct?

28 The graph below shows the variation in the average temperature of Earth's surface from 1950-2000, according to one source. 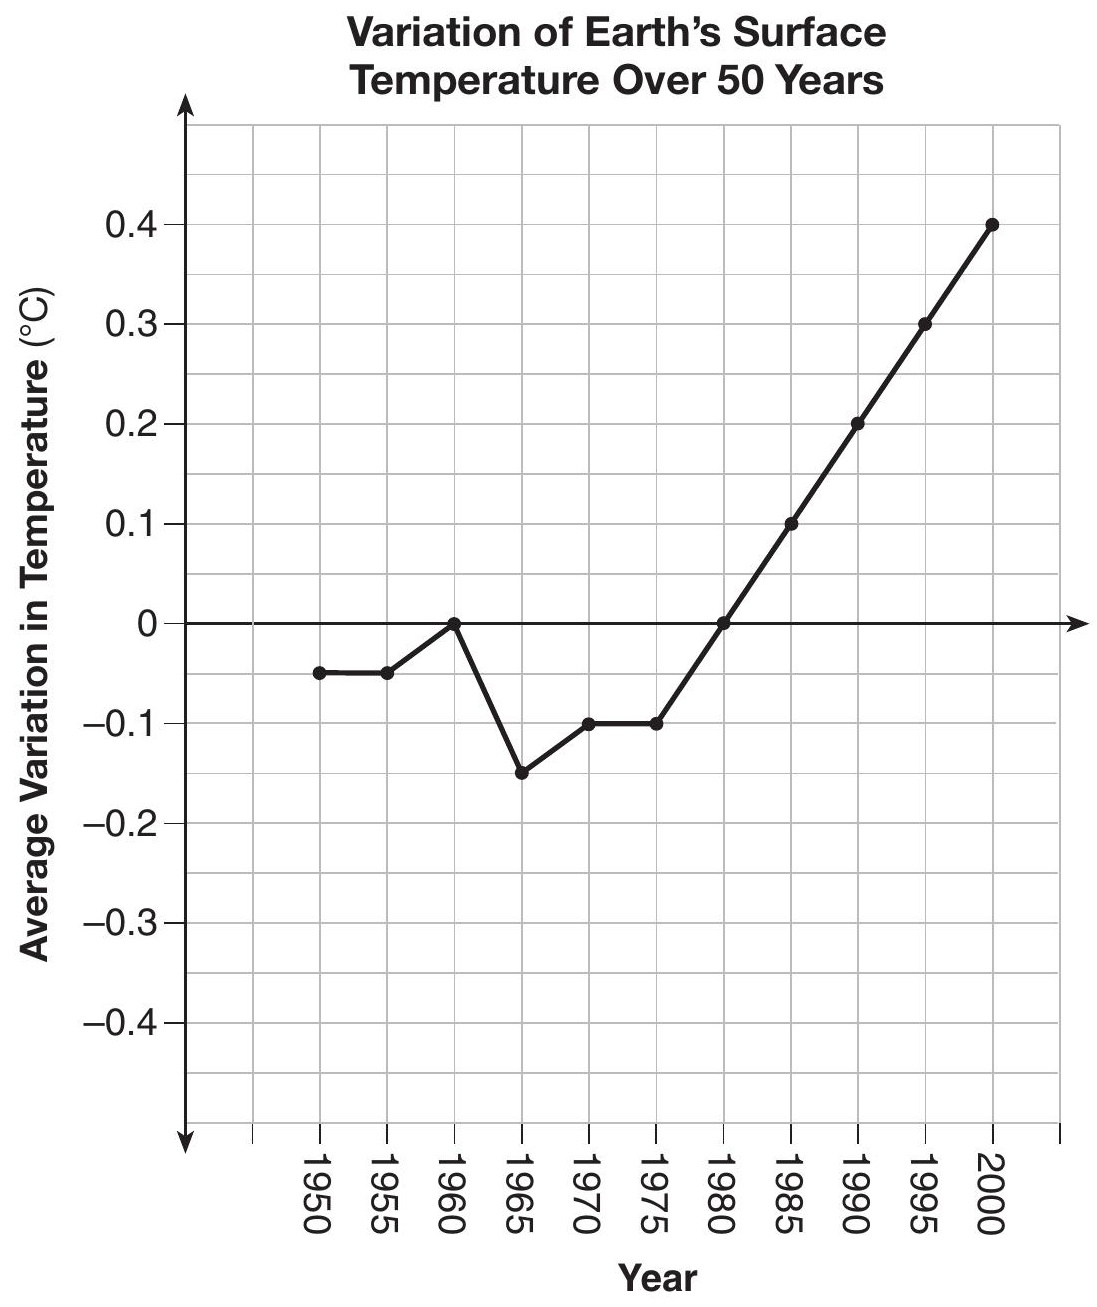 During which years did the temperature variation change the most per unit time? Explain how you determined your answer.

During which years did the temperature variation change the most per unit time? Explain how you determined your answer.

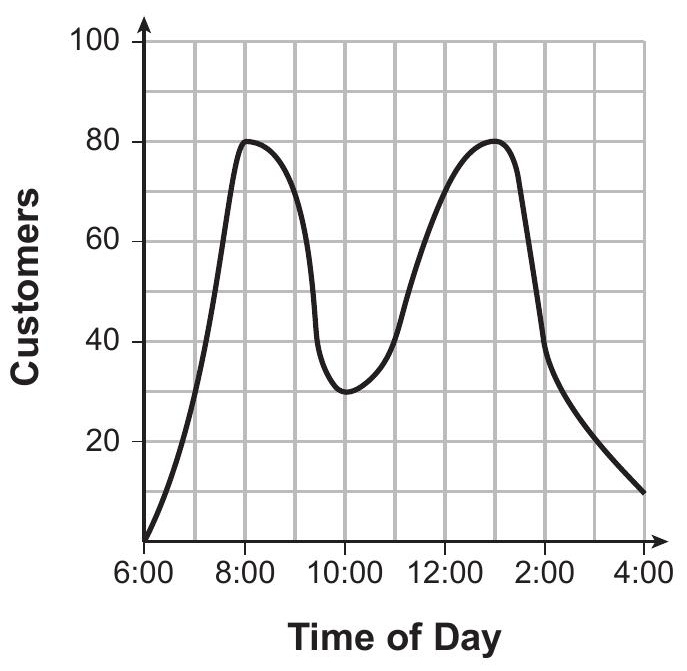
A café owner tracks the number of customers during business hours. The graph below models the data.
Based on the graph, the café owner saw a continual

Noah conducted a survey on sports participation. He created the following two dot plots to represent the number of students participating, by age, in soccer and basketball.
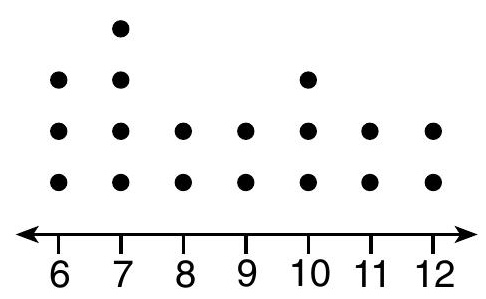
Soccer Players' Ages
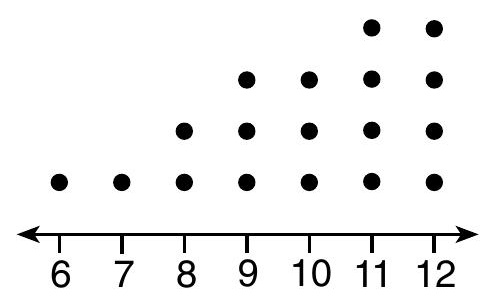
Basketball Players' Ages
Which statement about the given data sets is correct?

The dot plot below shows the number of goals Jessica scored in each lacrosse game last season.
Which statement about the dot plot is correct?

Jean recorded temperatures over a 24-hour period one day in August in Syracuse, NY. Her results are shown in the table below.
| Time (hour) | 0 | 3 | 6 | 9 | 12 | 15 | 18 | 21 | 24 |
|---|---|---|---|---|---|---|---|---|---|
| Temperature | 80 | 75 | 70 | 78 | 92 | 89 | 85 | 80 | 74 |
Her data are modeled on the graph below.
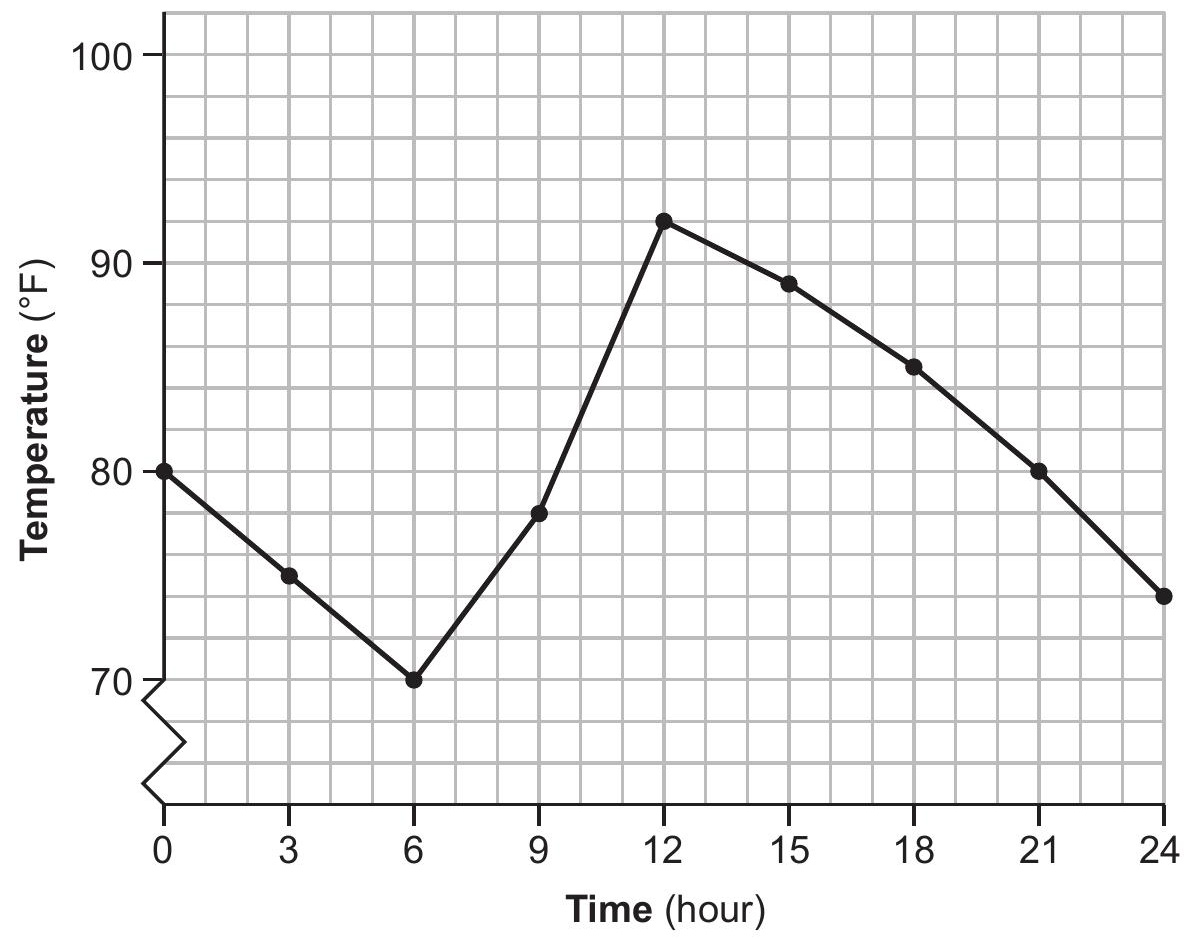

State the entire interval over which the temperature is increasing.

State the three-hour interval that has the greatest rate of change in temperature.

State the average rate of change from hour 12 to hour 24. Explain what this means in the context of the problem.

The height of a rocket, at selected times, is shown in the table below.
| Time (sec) | 0 | 1 | 2 | 3 | 4 | 5 | 6 | 7 |
|---|---|---|---|---|---|---|---|---|
| Height (ft) | 180 | 260 | 308 | 324 | 308 | 260 | 180 | 68 |
Based on these data, which statement is not a valid conclusion?

The heights, in inches, of 12 students are listed below. Which statement best describes the spread of these data?

The table below shows the number of reported polio cases in Nigeria from 2006 to 2015.
| Year | 2006 | 2007 | 2008 | 2009 | 2010 | 2011 | 2012 | 2013 | 2014 | 2015 |
|---|---|---|---|---|---|---|---|---|---|---|
| Number of Cases | 1129 | 285 | 798 | 388 | 21 | 62 | 122 | 53 | 60 | 0 |
What is the average rate of change, to the nearest hundredth, of the number of reported polio cases per year in Nigeria from 2006 to 2013?

Based on these data, which class has the largest spread of test scores? Explain how you arrived at your answer.

Explain which class has the largest spread of test scores based on the given data.
