All topics

With reference to four different properties of a soil, outline how each can contribute to high primary productivity.

Explain how the level of primary productivity of different biomes influences their resilience.

Discuss the role of feedback mechanisms in maintaining the stability and promoting the restoration of plant communities threatened by human impacts.

Distinguish between two named biomes and the factors that cause their distribution.

Evaluate one method for measuring primary productivity in a named ecosystem.

Discuss how human activities impact the flows and stores in the nitrogen cycle.

Figure 3: The number of plant species present on the slopes of two volcanoes, whicherupted in the 1880s. Measurements were taken in 1930, 1975 and 2015.
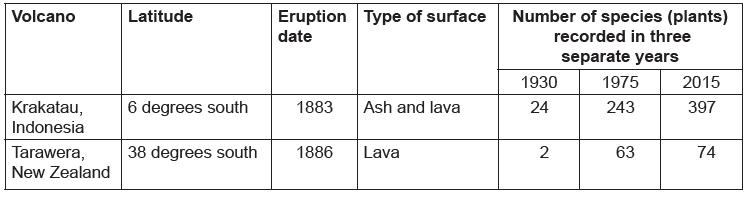
[Source: Data courtesy of Roger del Moral]

State the ecological processes illustrated by the data in Figure 3.

Describe a method for measuring the abundance of plant species in volcanic areas.

Suggest two reasons why there are differences in the number of plant species foundon Krakatau and Tarawera.

Figure 9(a): Fact file on the round goby (Neogobius melanostomus)
Figure 9(b): Pictures of the round goby and mottled sculpin
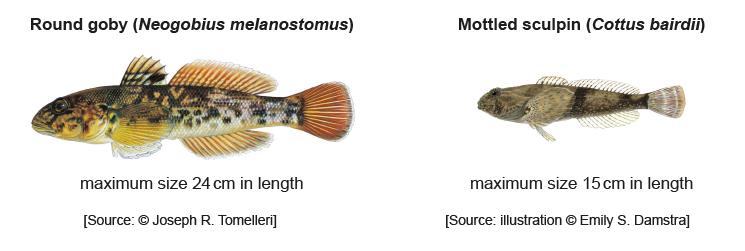

Using Figures 9(a) and 9(b), identify one feature of the round goby that shows it is an r-selected species.

With reference to Figure 9(a), outline how the round goby both positively and negatively affects the St Lawrence River ecosystem.

With reference to Figure 9(a), explain why the realized niche of the mottled sculpin has changed in recent years.

Outline one climatic and one edaphic (soil) factor which affect the final climaxcommunity in an ecosystem.

Explain two examples of soil degradation and the appropriate soil managementstrategies from a named farming system.

Evaluate the impact of economic development on the ecological footprint of a humanpopulation.

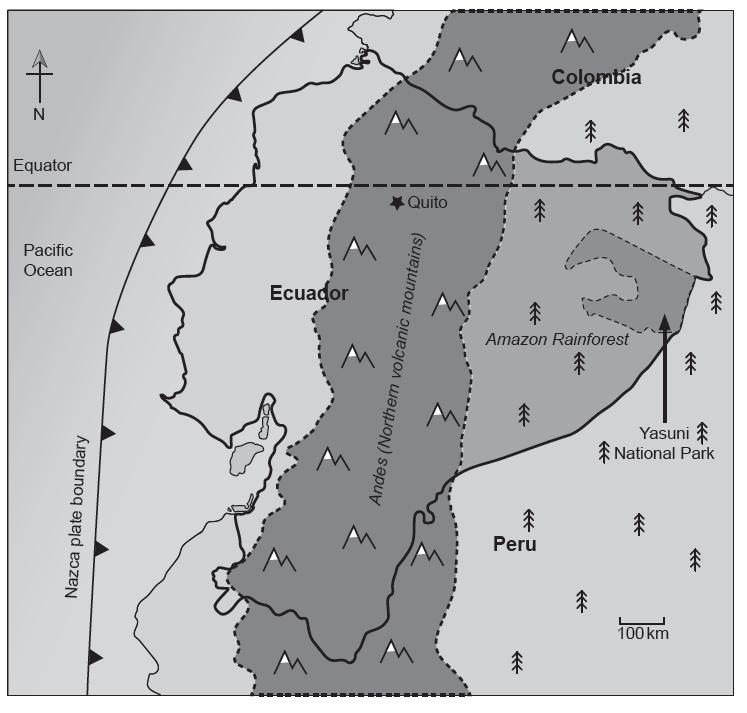
Figure 2: Map to show the location of Yasuni National Park in Ecuador,
a globally significant high biodiversity area

Define biodiversity.

With reference to Figure 2 identify three factors that could explain the high biodiversity in Ecuador.

Figure 3: Table to show the species richness of Yasuni National Park

Describe a method that may have been used for collecting the tree data in Figure 3.

With reference to processes occurring within the atmospheric systemidentify two transformations of matter.

With reference to processes occurring within the atmospheric systemidentify two transfers of energy.

Explain how regional differences in the hydrological cycle influence the formation ofdifferent biomes.

Climate can both influence, and be influenced by, terrestrial food production systems.
To what extent can terrestrial food production strategies contribute to a sustainableequilibrium in this relationship?

The resource booklet provides information on the Swakop River Valley. Use the resource booklet and your own studies to answer the following.
Figure 1(b): Map showing Swakop River in Namibia
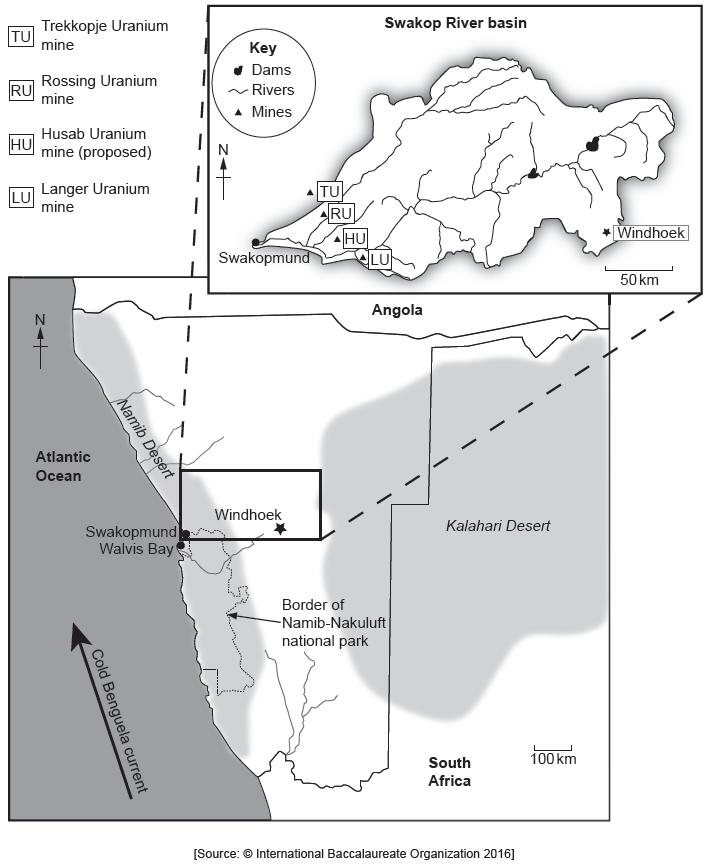
Figure 4(b): Investigation into the impact of Mesquite on mammals in the Swakop River Valley
The data in the table show the number species captured by camera shots, in two areas of different
mesquite densities, over 100 days.
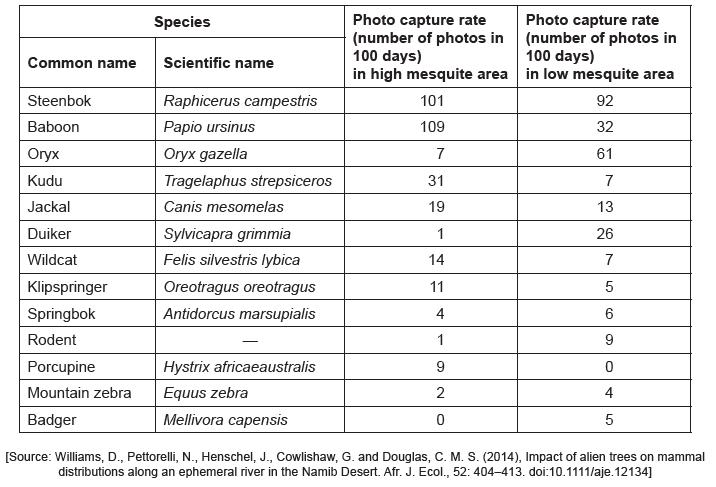
Figure 5(a): Graph to show Uranium prices from 1980 to 2013
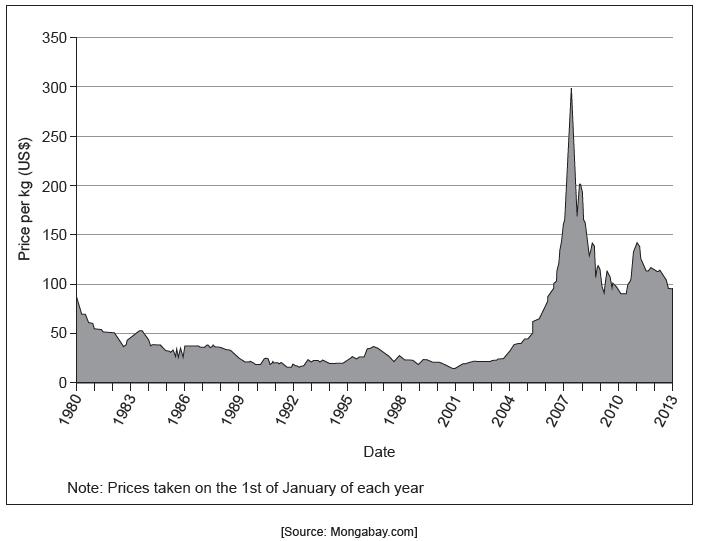
Figure 6(a): Strategic Environmental Management Plan (SEMP) for the Swakop Valley
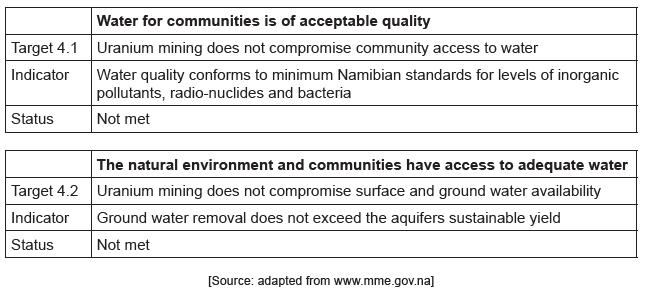
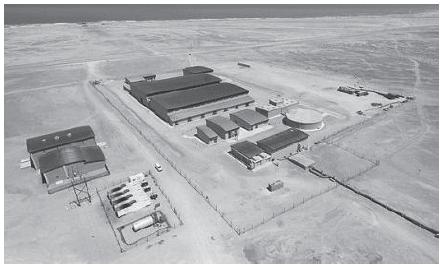
Figure 7: Erongo water desalination plant
[Source: Adapted from http://www.world-nuclear-news.org/C-Areva\_water\_plant\_to\_supply\_Namibian\_mines-1908134.html\]

State the biome for the area shown in Figure 1(b).

Identify three natural sources of water available in the Swakop area.

Outline two reasons why the Swakop river is considered to be ecologically important.

Outline whether an invasive species such as Mesquite is likely to be r-strategist or_K_-strategist.

With reference to the data in Figure 4(b), suggest two conclusions which can be drawnfrom the camera trap data.

Justify whether or not Mesquite should be cleared from the Swakop River Valley.

With reference to Figure 5(a) describe how Uranium prices have changed over time.

Outline two reasons why the value of resources like Uranium can change over time.

With reference to Figure 6(a) describe two ways in which Uranium mines have had animpact on water resources.

With reference to Figures 6(a) and 7, calculate the amount of water available for otheruses, after the Erongo desalination plant has met the needs of the three operationalmines.

Using evidence from the resource booklet, justify from an ecocentric viewpoint why theHusab Uranium Project should not be approved.

The resource booklet provides information onDominica. Use the resource booklet and your own studies to answer the following.

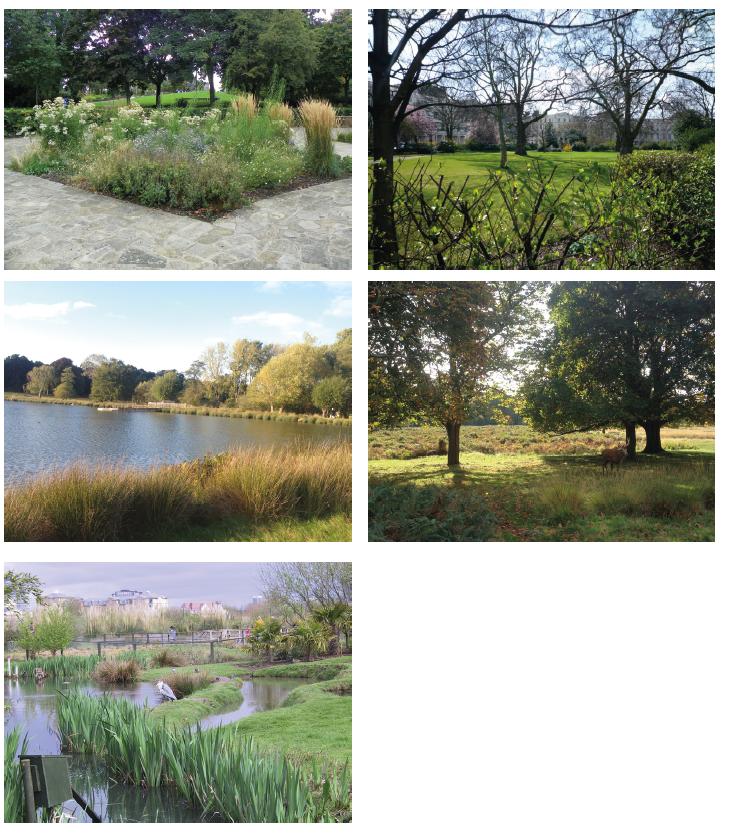
Figure 2(b): Examples of ecosystems in London
[Source: (top left) O’Connor, P., 2015. GOC Walthamstow to Stratford 164: Old English Garden, Victoria Park. [image
online] Available at: https://www.flickr.com/photos/anemoneprojectors/25609419345/in/photostream/Attribution-
ShareAlike 2.0 Generic (CC BY-SA 2.0) https://creativecommons.org/licenses/by-sa/2.0/[Accessed 22 May
2020]. Source adapted.
(top right) Taylor, J., 2009. Park Crescent, London NW1 private communal garden. [image online] Available at:
https://fr.m.wikipedia.org/wiki/Fichier:Park_Crescent,_London_NW1_private_communal_garden_-_geograph.org.
uk_-_1268358.jpg Attribution-ShareAlike 2.0 Generic (CC BY-SA 2.0) https://creativecommons.org/licenses/bysa/
2.0/ [Accessed 22 May 2020]. Source adapted.
(bottom left) Haywood, Jay., 2004. Grey Heron in London Wetlands Centre. [image online] Available at:
https://commons.wikimedia.org/wiki/File:Grey_Heron_in_London_Wetlands_Centre_-_geograph.org.uk_-
_795424.jpg Attribution-ShareAlike 2.0 Generic (CC BY-SA 2.0) https://creativecommons.org/licenses/by-sa/2.0/[Accessed 22 May 2020]. Source adapted.
(center left and right) Oberst, T., 2019 Untitled. [photograph].]
Figure 3: Climate graph for London
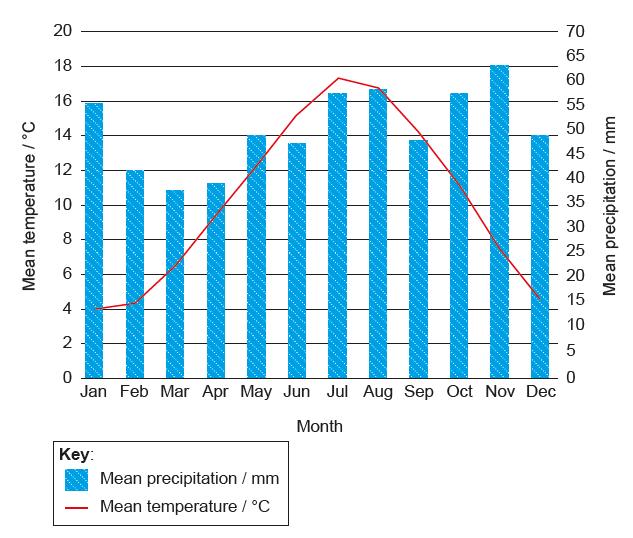
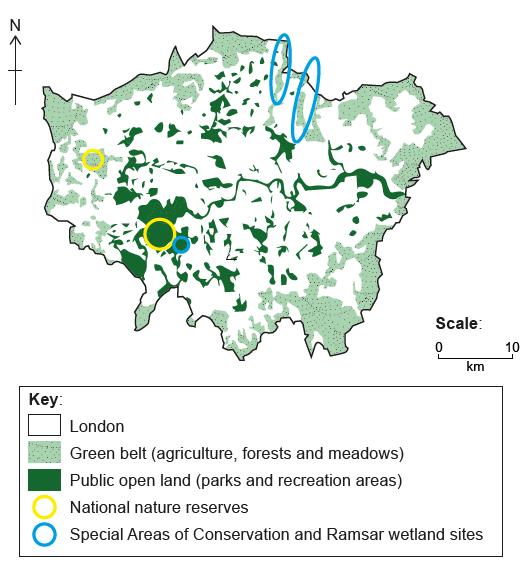
Figure 4(a): Green spaces in London
[Source:Greater London Authority, 2016. Draft Economic Evidence Base 2016. [online] Available at: https://www.london.
gov.uk/sites/default/files/draft-eeb-2016.pdf [Accessed 1 June 2020].]

With reference to Figures 2(b) and 3, identify an ecosystem found in London.

Outline one factor which limits the primary productivity of an ecosystem in London.

Identify one distribution pattern of green spaces seen in Figure 4(a).

Outline three ways that London’s green spaces are considered natural capital.
