
Describe two methods for measuring biodiversity in an ecosystem.

Describe two types of symbiotic relationships in ecosystems, providing an example for each.

Explain how the following concepts relate to population dynamics:

Carrying capacity

Exponential growth

Figure 5: Fact file on deer species found in London
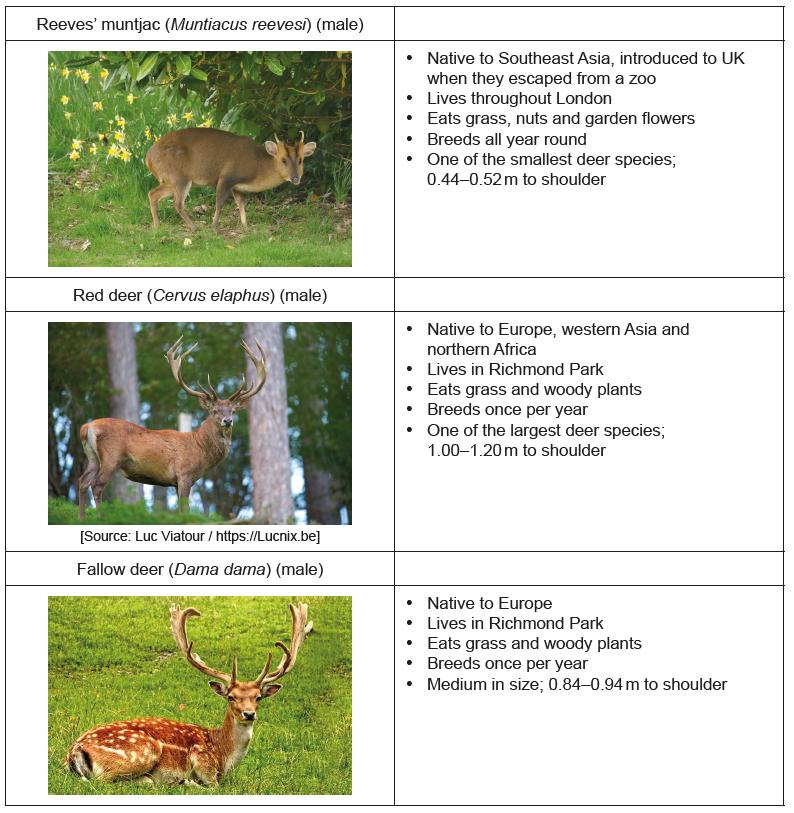
[Source:Nilfanion, 2010. Muntjac deer at Dumbleton Hall. [image online] Available at:
https://fr.wikipedia.org/wiki/Fichier:Muntjac_deer_at_Dumbleton_Hall.jpgAttribution-ShareAlike 3.0 Unported (CC
BY-SA 3.0) https://creativecommons.org/licenses/by-sa/3.0/deed.en[Accessed 22 May 2020]. Source adapted.
Lviatour, 2011. Cervus elaphus Luc Viatour 6. [image online] Available at:
https://commons.wikimedia.org/wiki/File:Cervus_elaphus_Luc_Viatour_6.jpgAttribution-ShareAlike 3.0 Unported
(CC BY-SA 3.0) https://creativecommons.org/licenses/by-sa/3.0/deed.en[Accessed 22 May 2020]. Source
adapted.
Manfred Antranias Zimmer /Pixabay.com, 2018. Striking Fallow Deer Buck, boasting an impressive rack. [online]
Available at: https://pixabay.com/photos/antler-fallow-deer-deer-dama-dama-899123/\[Accessed 13 September
2021].]
Figure 6(a): Population of deer in Richmond Park, 2013–2017
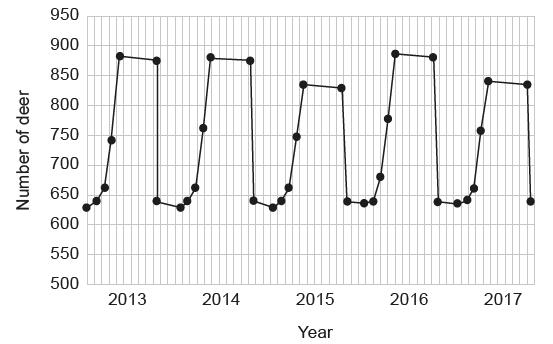
Figure 6(b): Number of deer removed from Richmond Park, 2013–2017
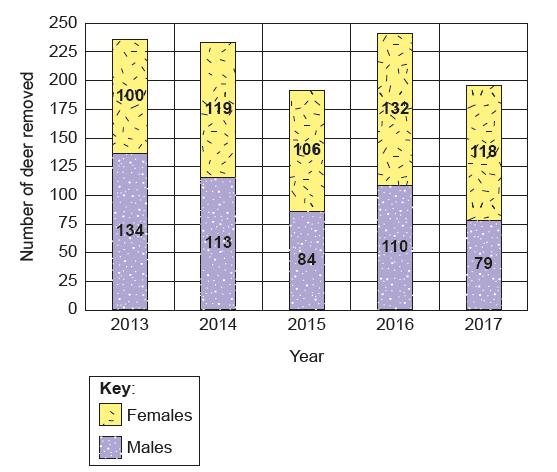
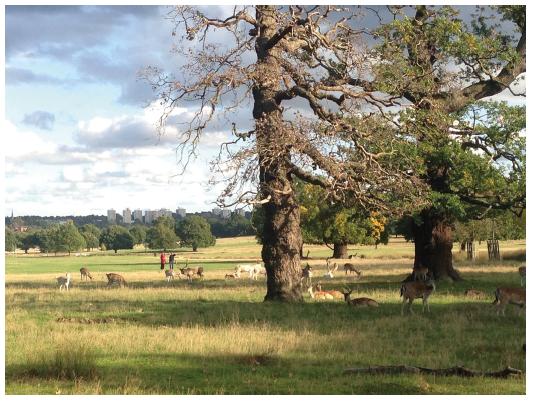
Figure 6(c): Fact file on Richmond Park
Richmond Park is a national nature reserve and Special Area of Conservation.
[Source:The Royal Parks, 2020. Deer in Richmond Park. [online] Available at: https://www.royalparks.org.uk/parks/
richmond-park/richmond-park-attractions/wildlife/deer-in-richmond-park [Accessed 1 September 2020].
Oberst, T., 2019. Untitled. [photograph].]

Using Figure 5, construct an identification key for the deer species found in London.

With reference to Figures 6(a), 6(b) and 6(c), predict how the ecosystem would be affected if the deer population in Richmond Park was not managed.

Explain the concept of density-dependent and density-independent factors in population regulation.

The resource booklet provides information on Algonquin Provincial Park in Canada. Use the resource booklet and your own studies to answer the following.
Figure 6: Simplified Algonquin Provincial Park food web
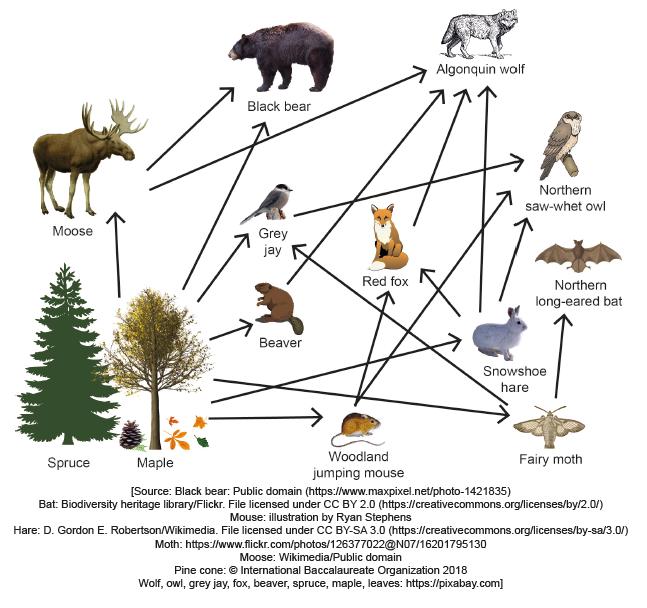

With reference to Figure 6, draw a food chain that includes four trophic levels.

Identify two ways that human activity in Algonquin Provincial Park may affect the food web.

Describe the concept of biomagnification and provide an example.

Describe two ways in which human activities have altered global nutrient cycles.

Define the term "ecosystem" and explain its key components.

Figure 4: The gross and net productivity at different trophic levels within the Silver Springs,Florida, ecosystem.
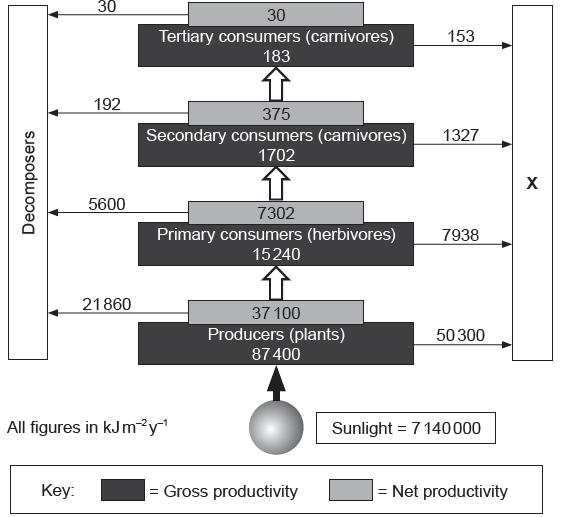
[Source: Kimball's Biology Pages © John W. Kimball, distributed under a Creative Commons Attribution 3.0 Unported (CC BY 3.0) license]

State the process represented in the box labelled X.

Define net primary productivity.

Describe how the second law of thermodynamics operates in relation to the transfer ofenergy within the Silver Springs ecosystem.

Distinguish between a pyramid of numbers and a pyramid of productivity.
